Chart Aggregations
Data Tables and Heatmaps are useful charts to improve visualization if you have many discrete series.
- Compared to a Line chart, Heatmaps can render 20 unique series and still be viewable by human eyes.
Limitations: this chart type cannot use a per-regression (scatter plot) time scale.
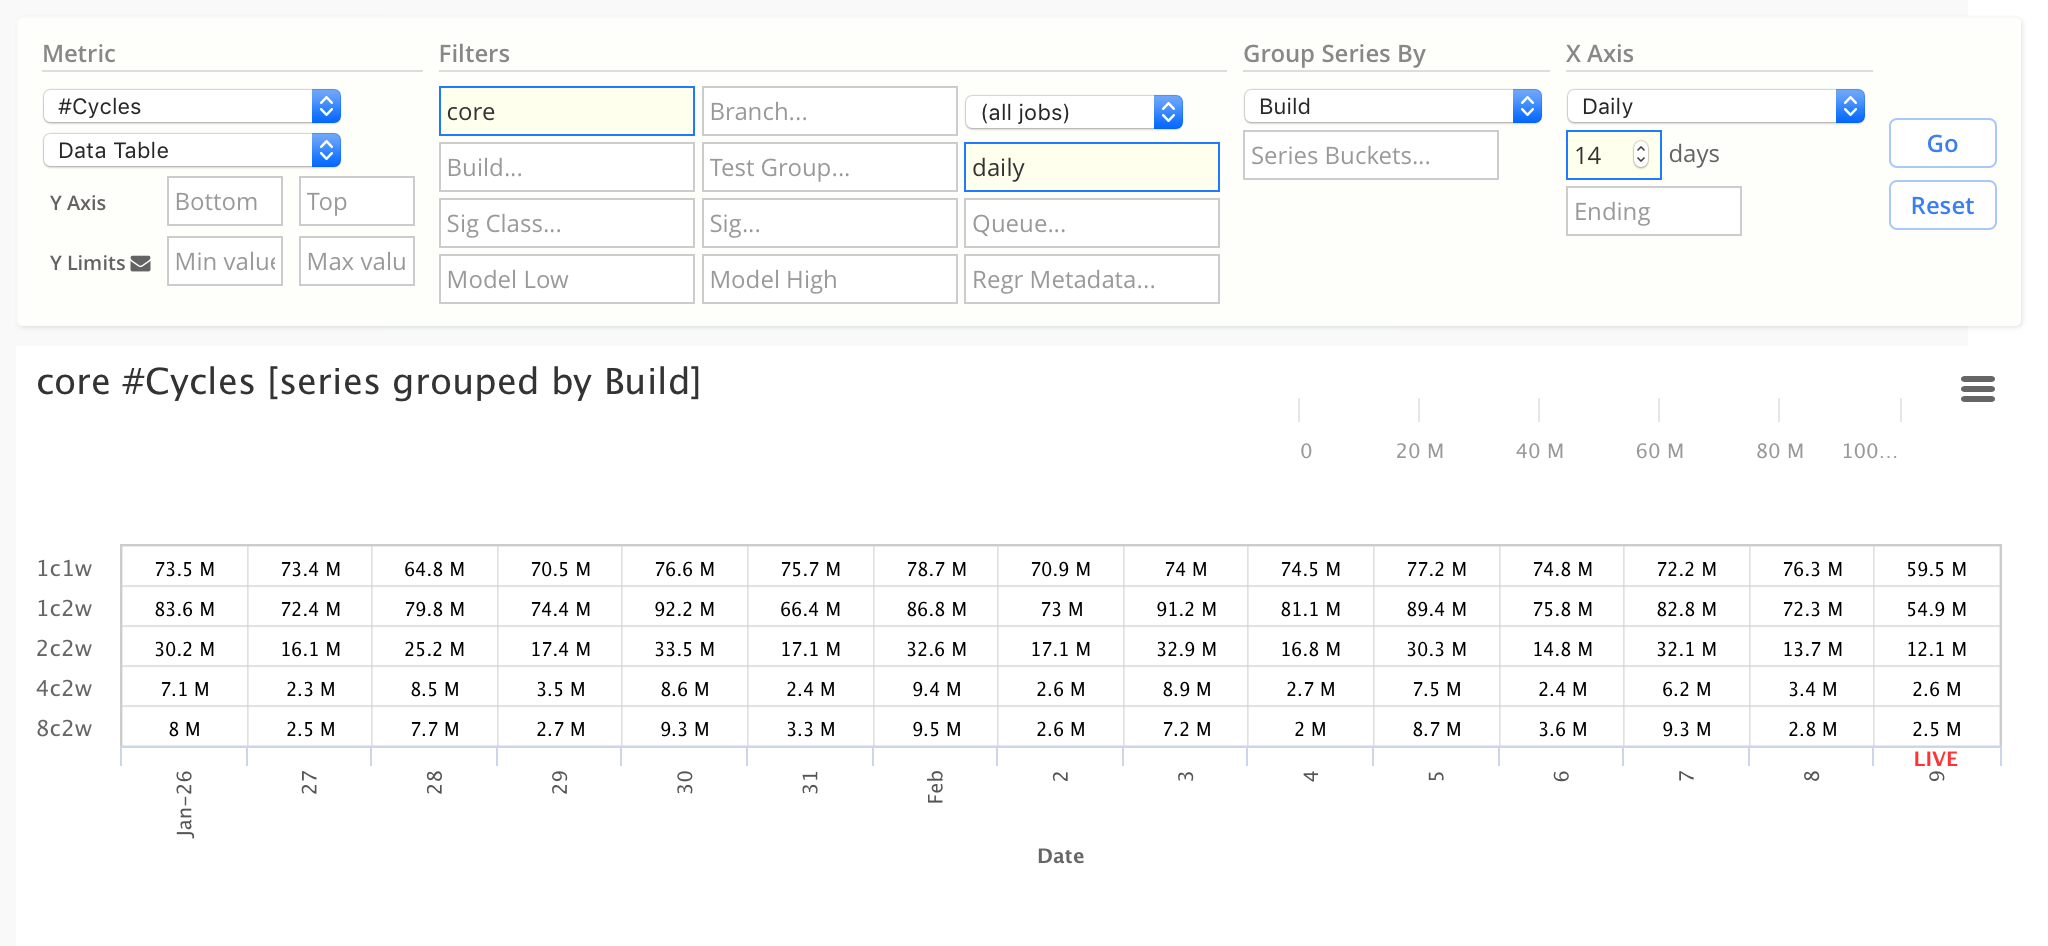
Data Table
Data Tables render all values in a tabular format. Each series is split into its own line.
- These are useful to see all values on a chart simultaneously.
This example chart shows daily cycles simulated, grouped by build:
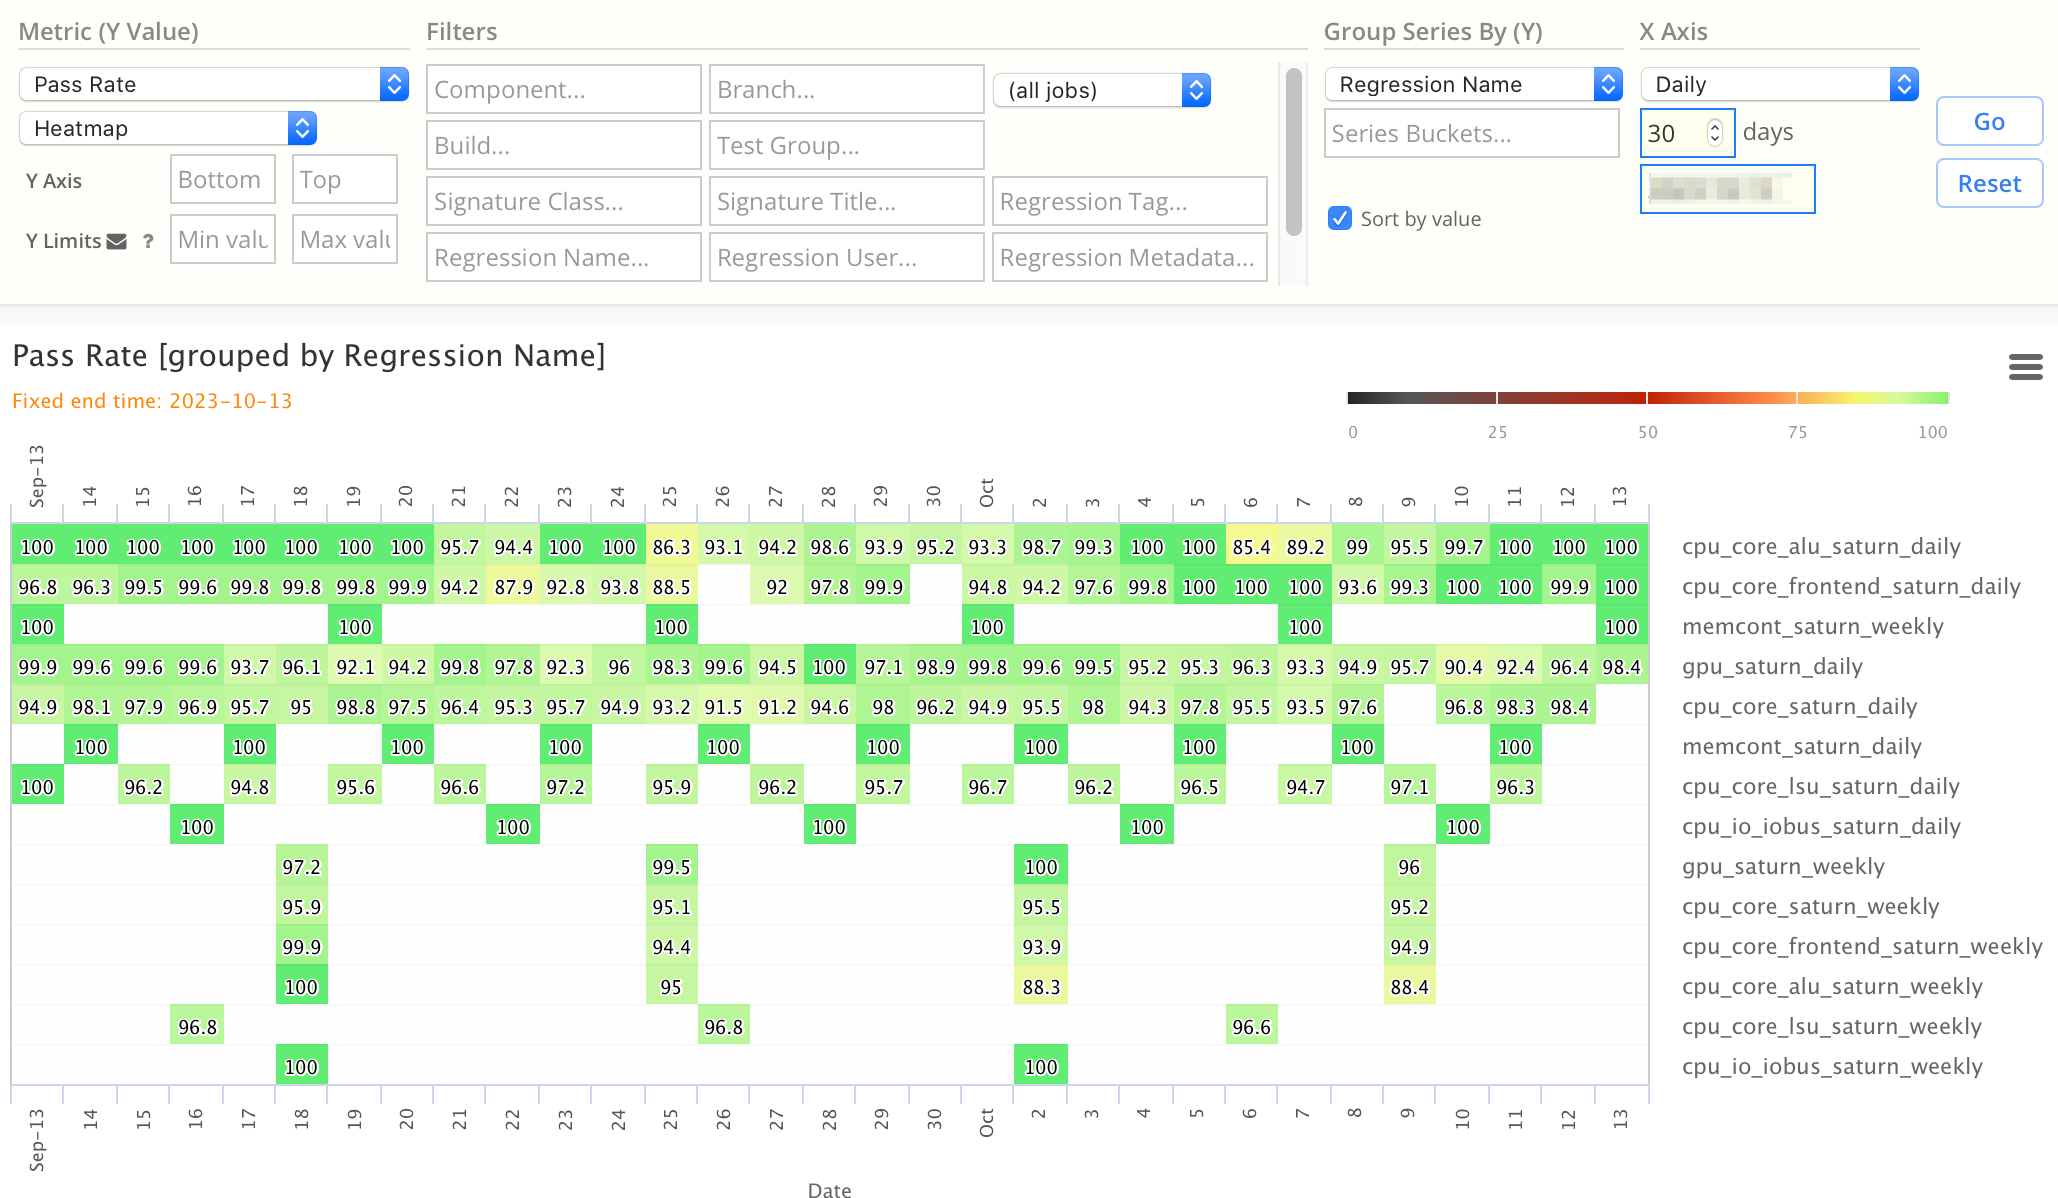
Heatmap
Heatmaps are the same charts as Data Tables, except they colorize based on values, to make changes easier to spot visually.
This example chart shows daily pass rate:
- Notice green, yellow, and orange colors
- This has a special color map which ranges from black (0%) to green (100%)
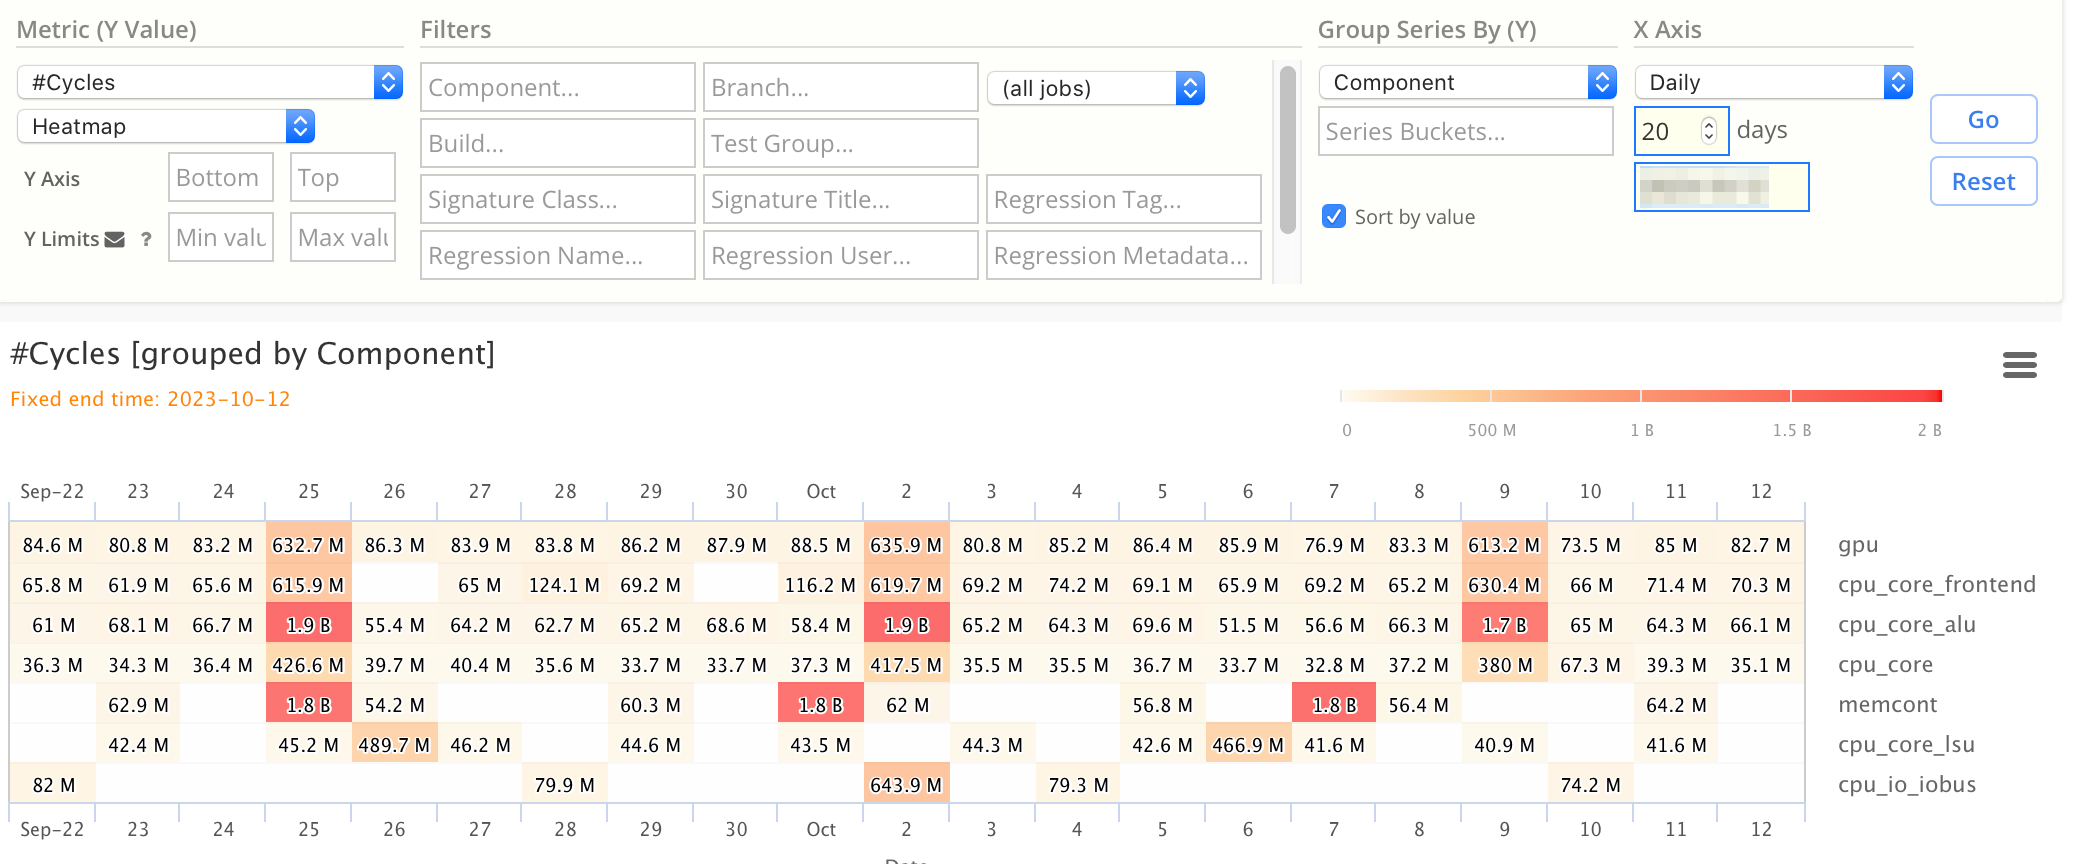
Daily Cycles Heatmap
This chart shows total cycles simulated per day, grouped by component.
- Note the hot colors are red, and the cold colors are white.
- The largest week was 1.9 billion (ie brightest red).
- This is a 20-day chart.
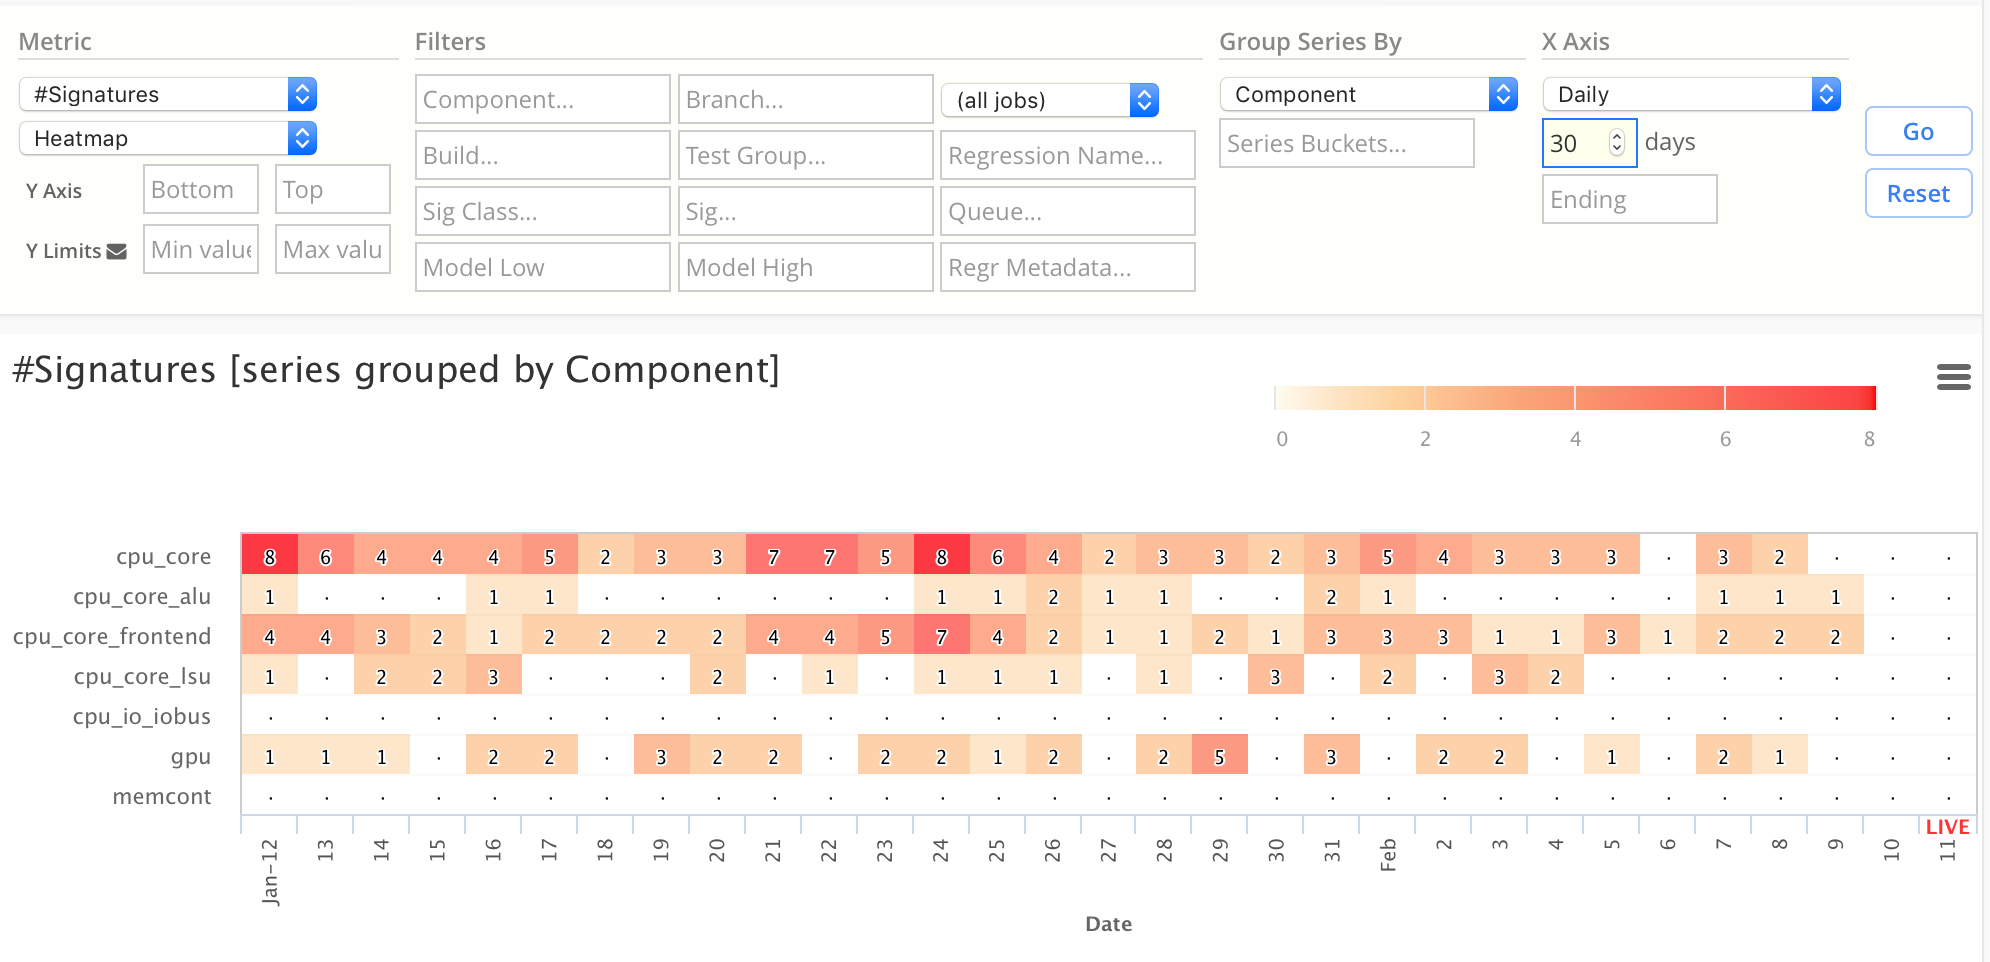
Daily Signatures Heatmap
This chart shows total daily Signatures, grouped by component.
- Note the hot colors are red, and the cold colors are white.
- Blank squares mean there were either no signatures (or no simulations) on that date.
- This is a 30-day chart.
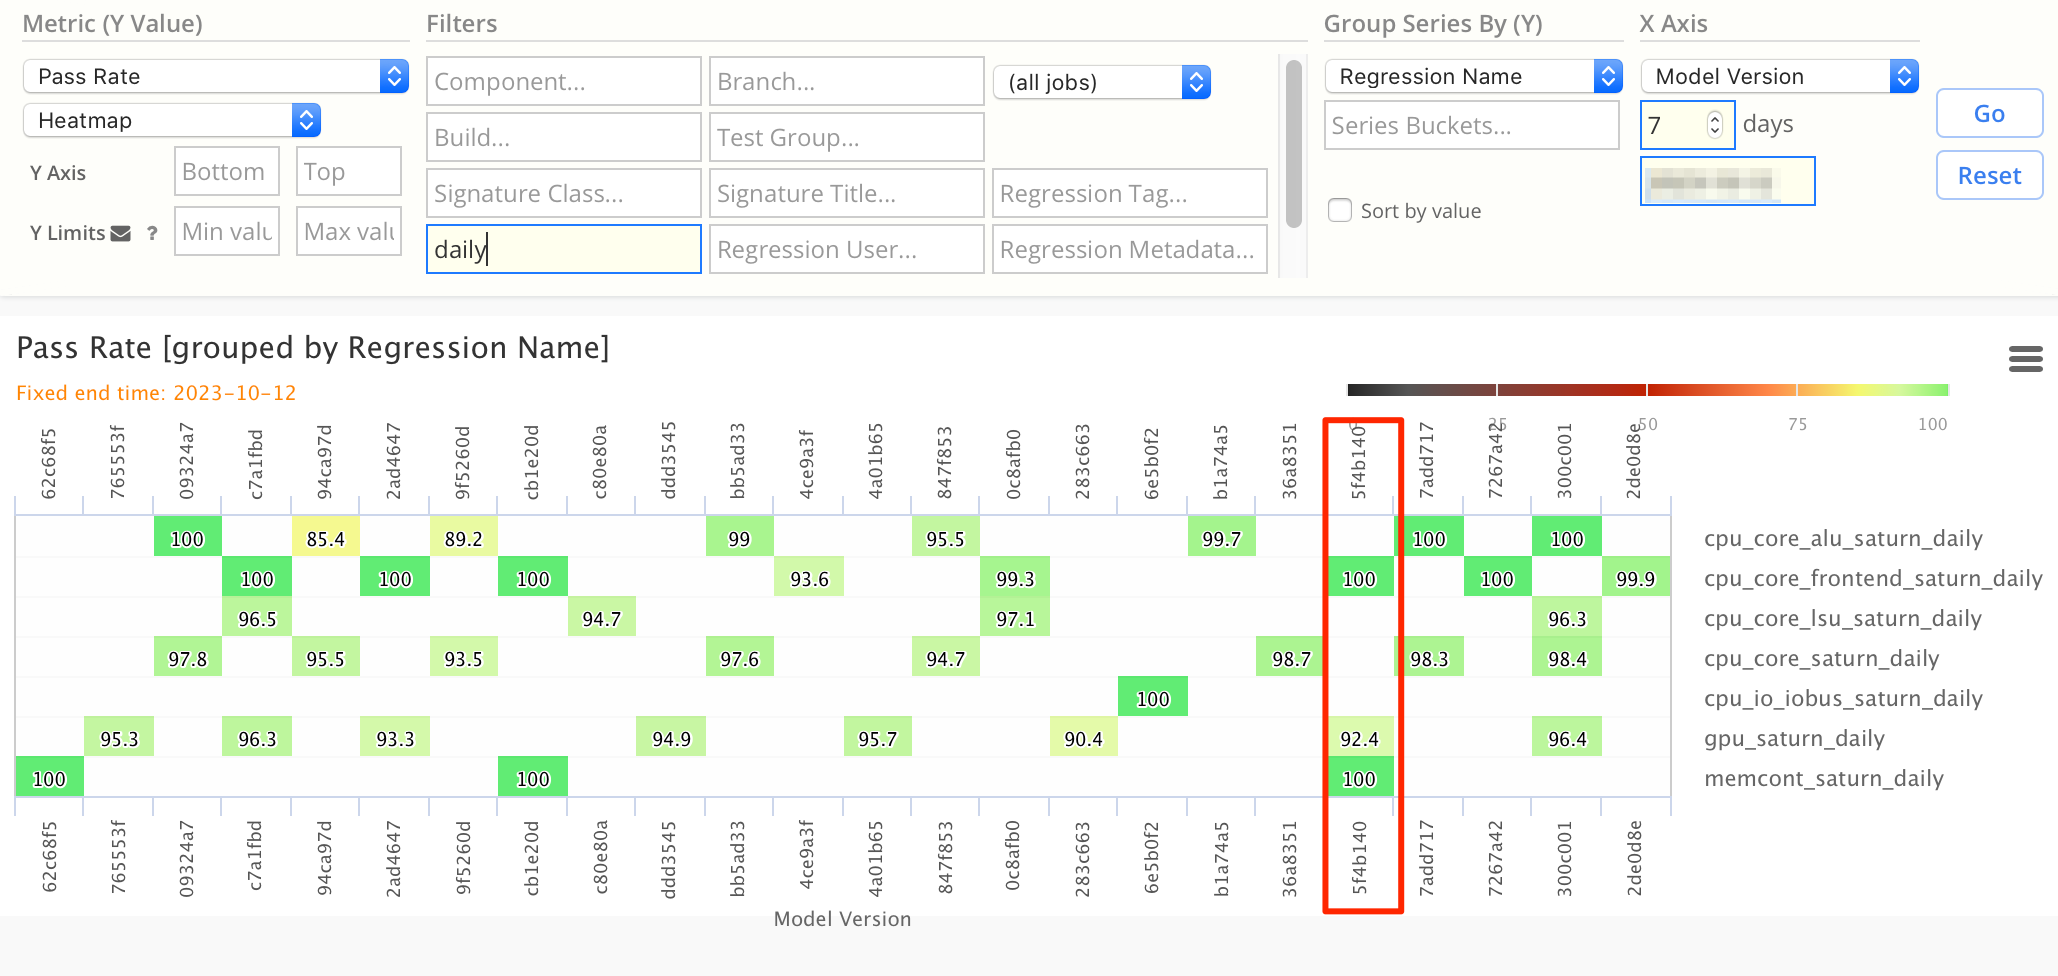
Advanced: Regression Pass Rate by ModelVersion
This chart shows component pass rate, where the X-axis is by model version (ie checkin).
- Note the X-axis is not days, but is each individual checkin (SHA).
- This is useful for seeing how checkins affect each unit.
For example, the red box highlights SHA 5f4b110, and where 3 separate regressions were simulated against this same model version.