Area Charts
Note: Area Charts are similar to Bar Charts, except connecting with lines instead of bars.
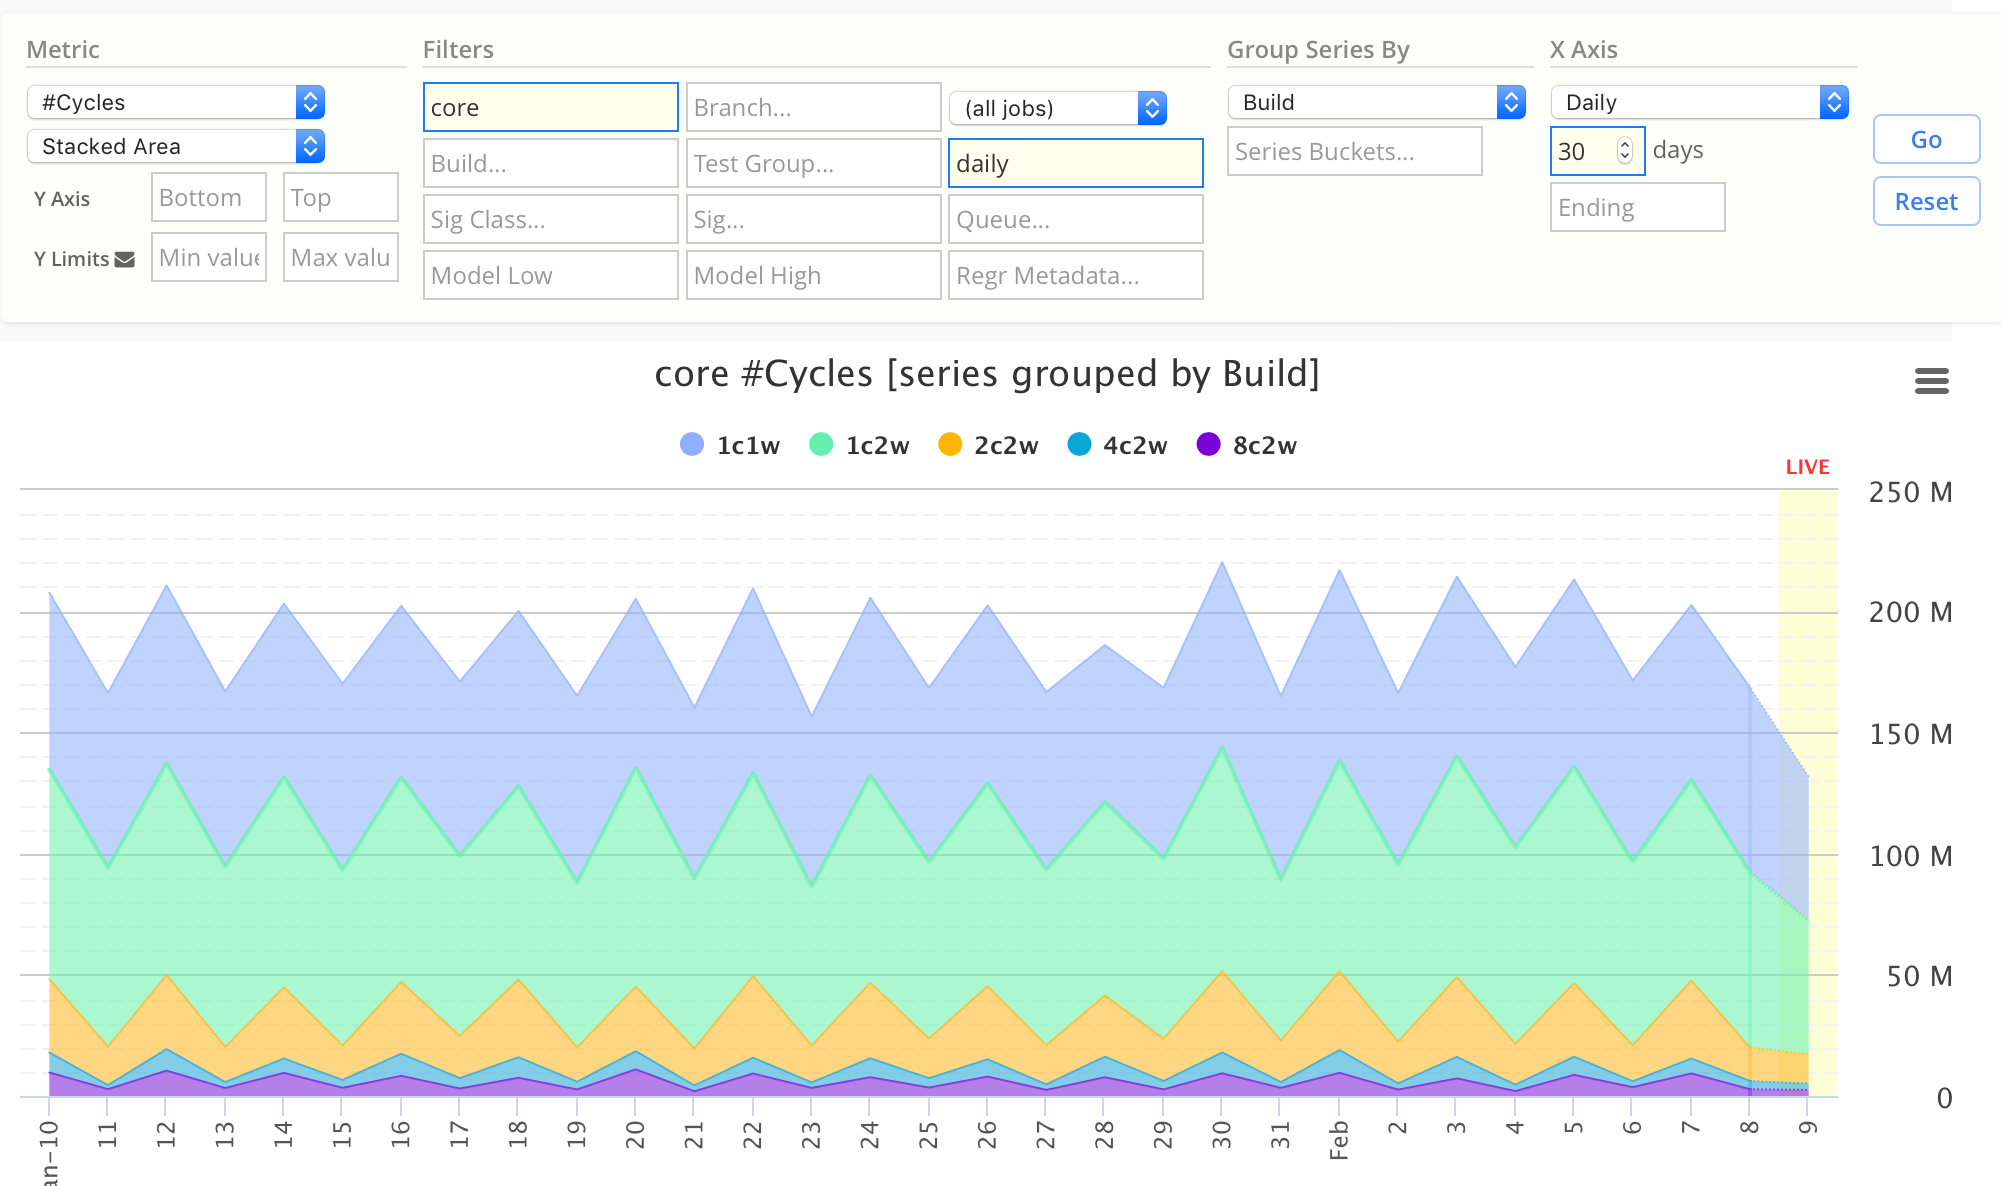
Stacked Area
Stacked Area charts stack series on top of each other.
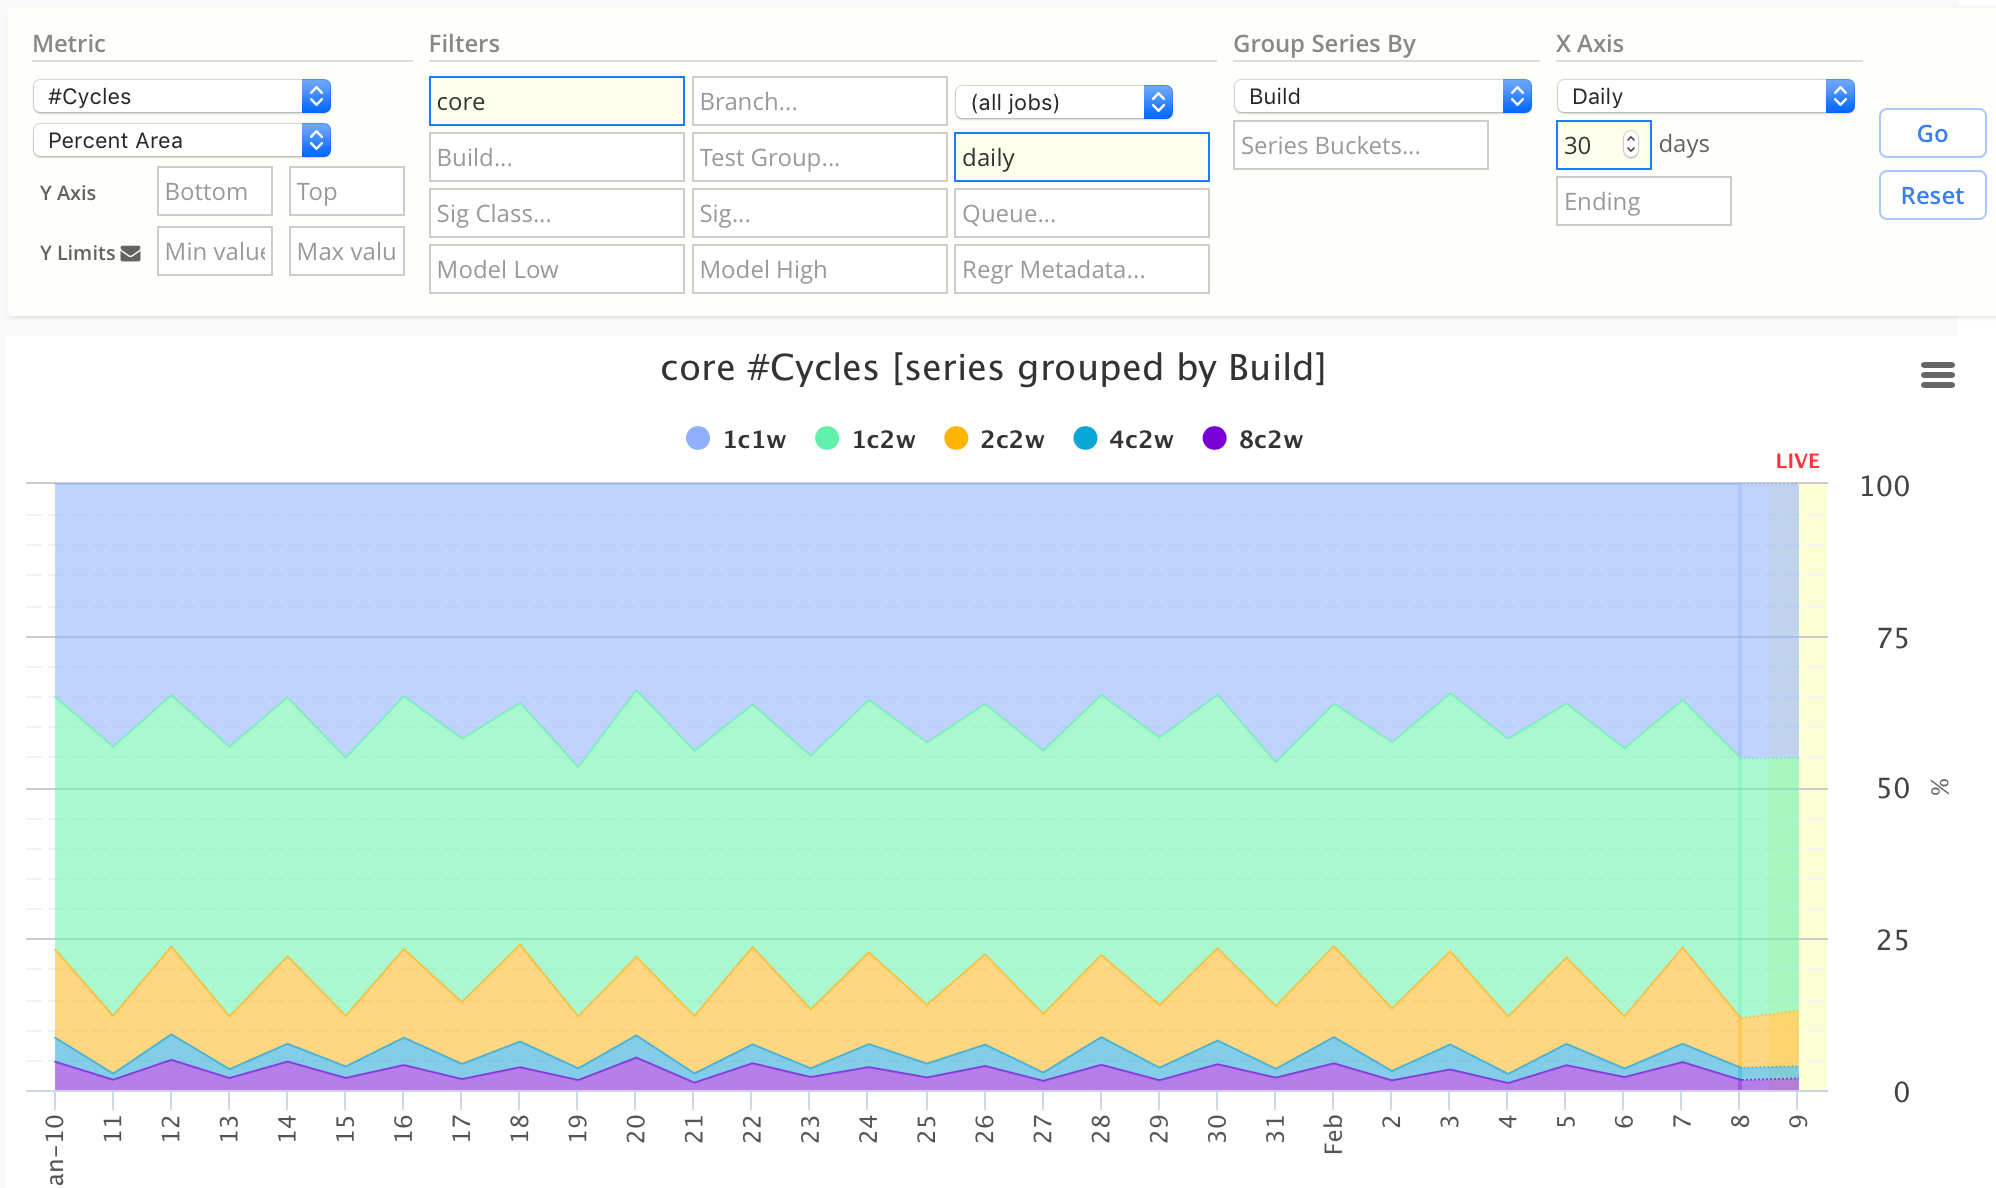
Percent Area
This is the same as Stacked Area, except each Y value is normalized to 100% total.
- This lets you visualize ratios over time.
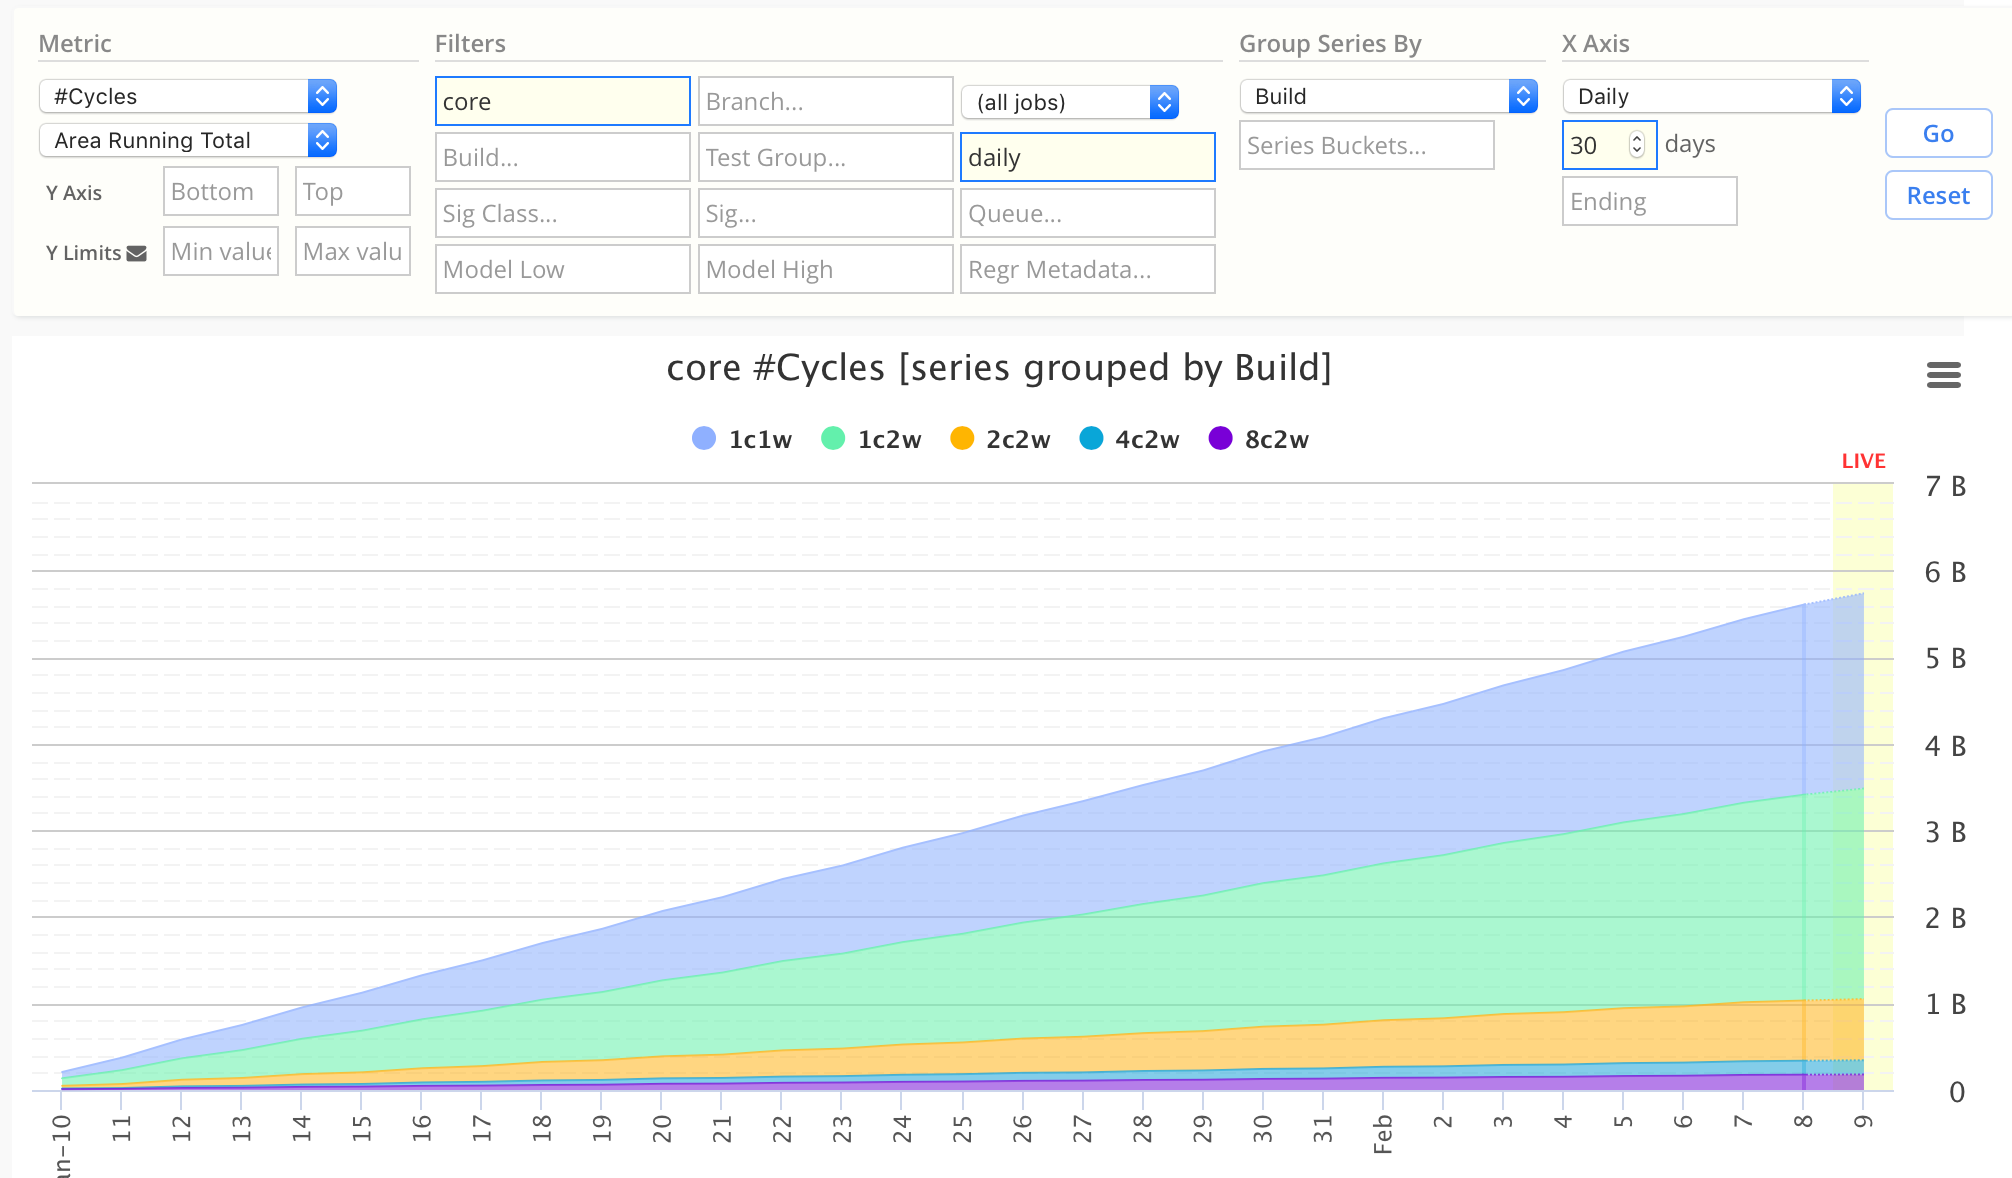
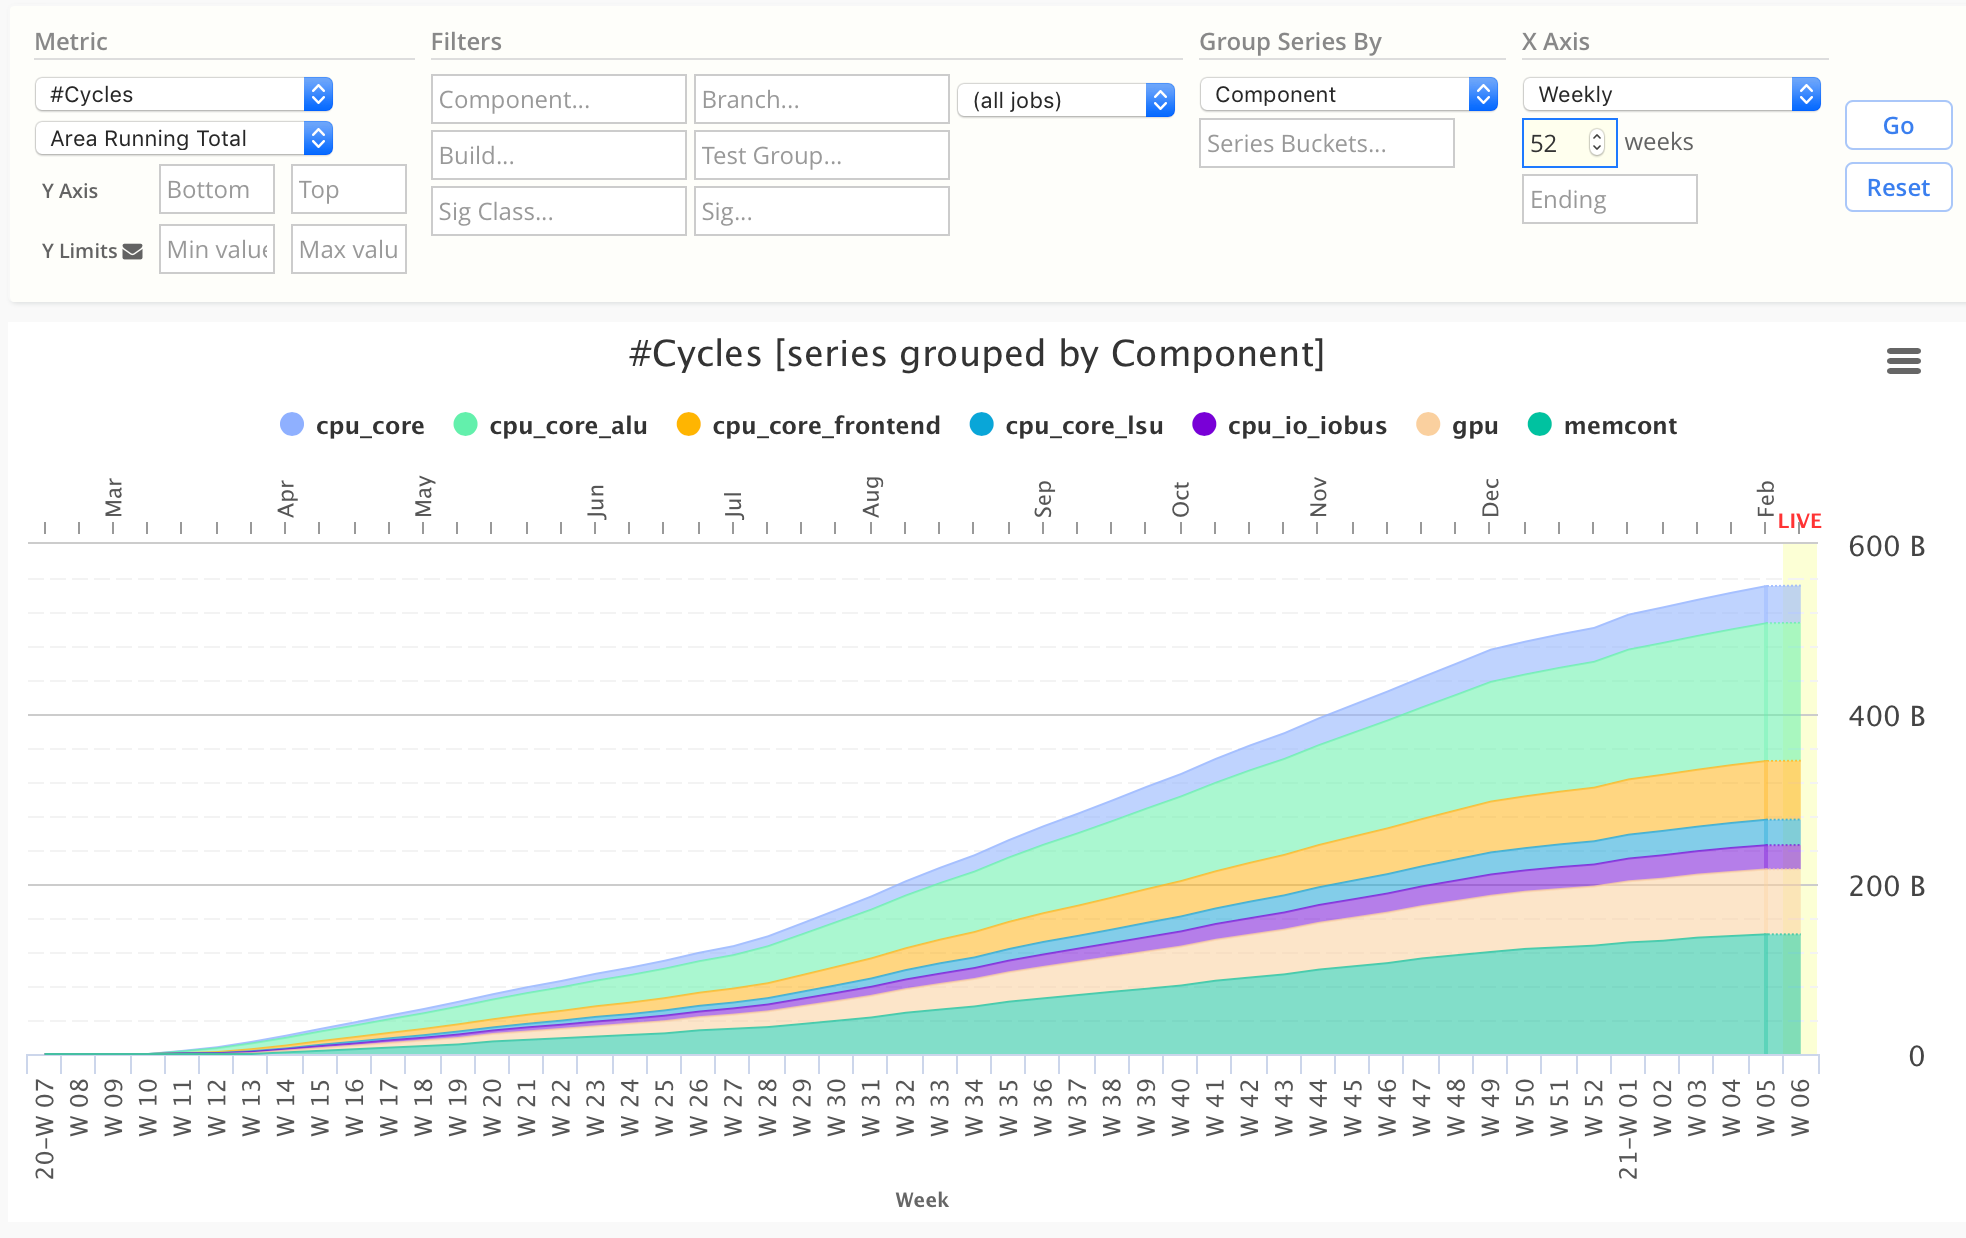
Area Running Total
Area Running Total is a cumulative chart, where each time segment value is the sum of all prior time segment values.
- This chart is also referred to as a summation chart.
This is useful for generating running-total charts, like "Cumulative Cycles by Day".
Another example chart: Cumulative Cycles grouped by Component
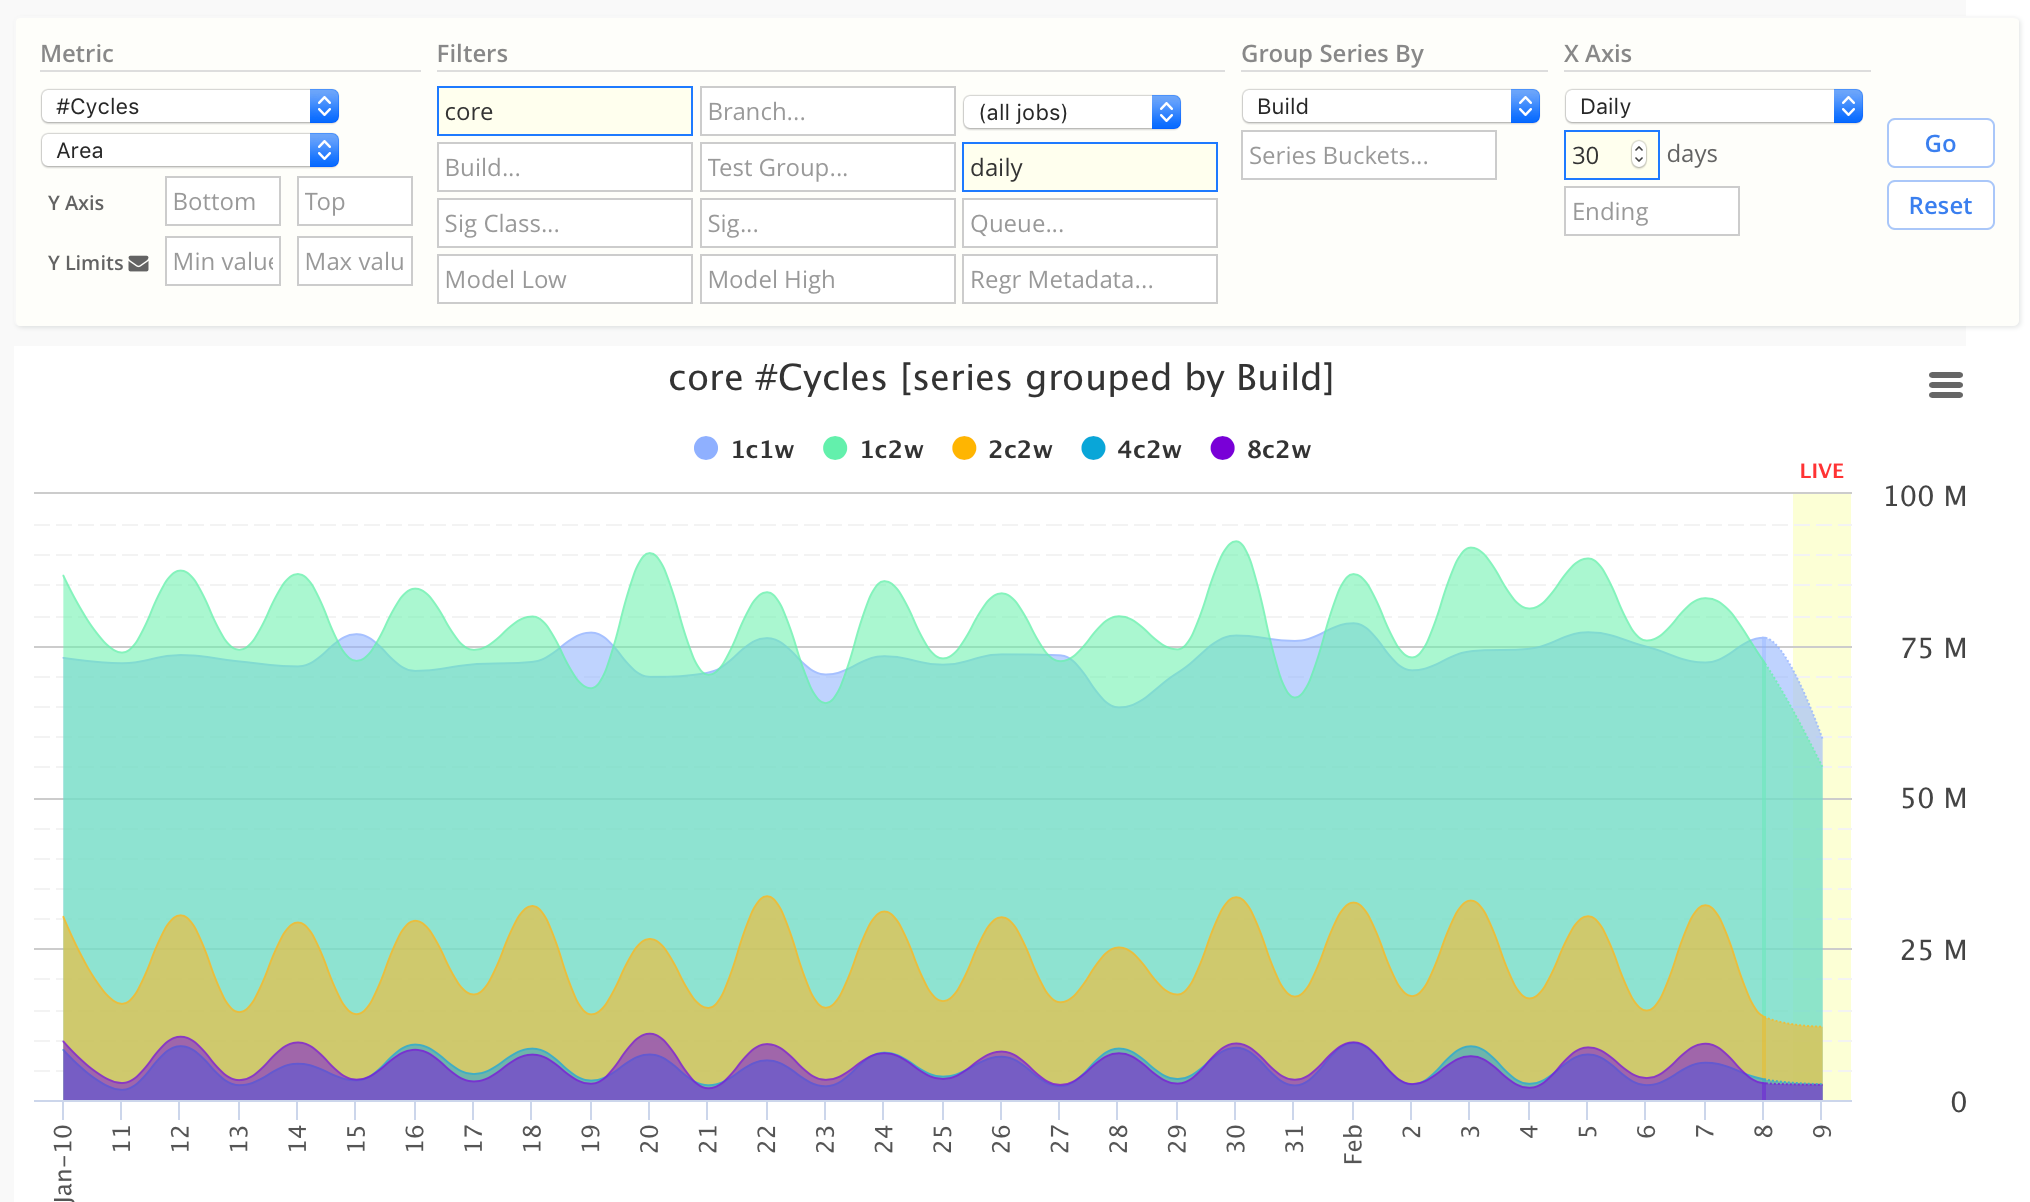
Area
Area charts overlap series on top of each other.
Note: this chart should be used rarely, as Stacked Area is almost always better.