Pie Charts
Pie charts are useful at showing ratios or comparisons of aggregated data.
X Axis
Pie charts do not have an X-axis, so all data will be totaled, across the selected time range into a single pie chart.
- For example: a 30-day (or 1-year) time range will accumulate all matching results into a single pie chart.
Note: to visualize changes over time with an X-axis, a Stacked Area Chart is often a better choice than a Pie chart.
Example Pie Charts
Compute Time, by Component
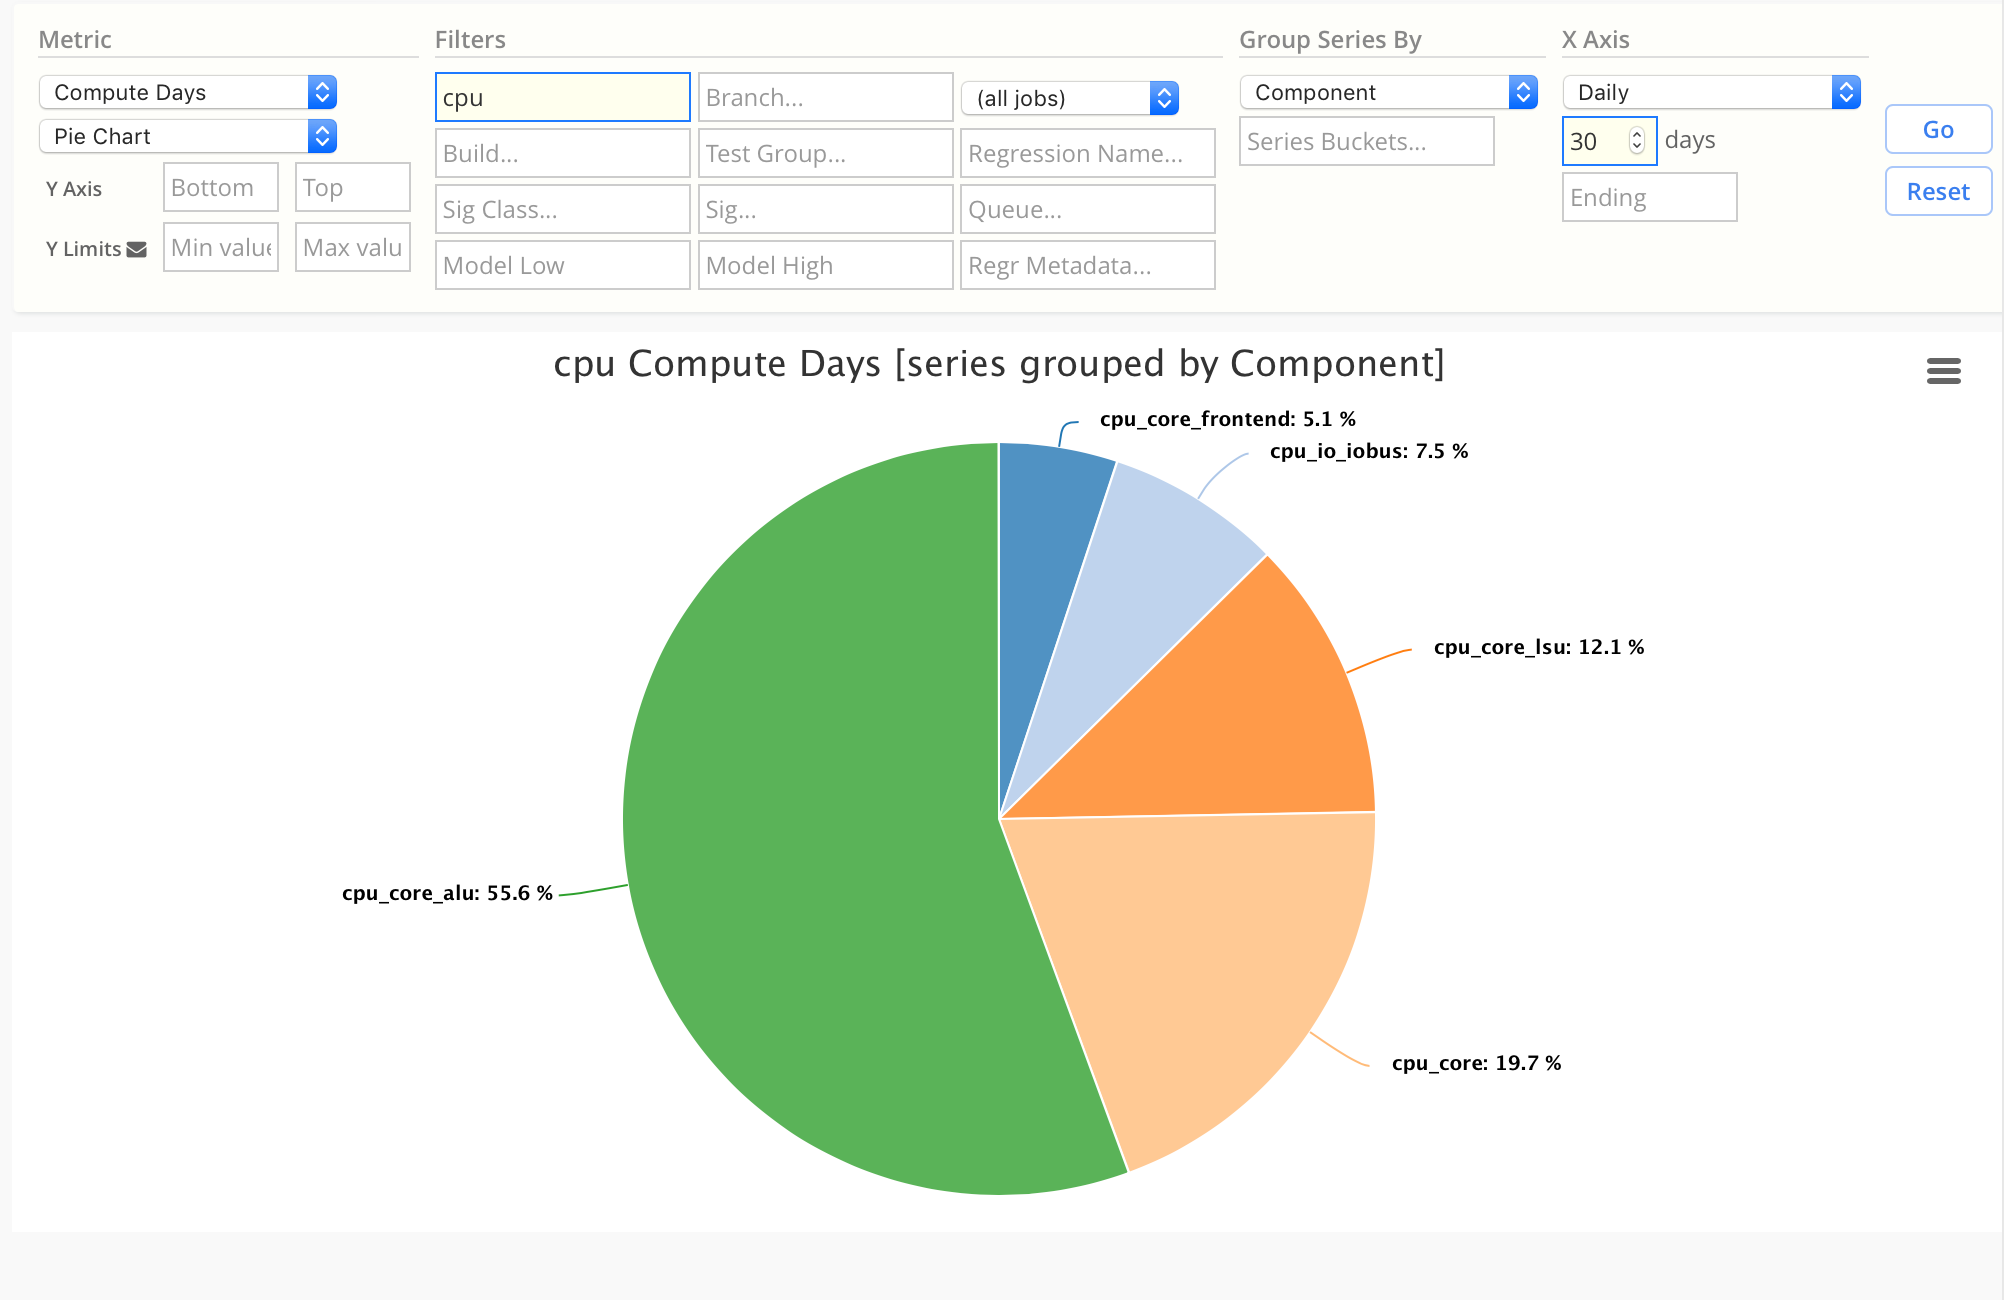
This example shows the percentage of compute time each cpu component is using,
for the past 30 days.
cpu_core_aluis using the most, at55.6%cpu_core_frontendis using the least, at5.1%
Configuration:
| Chart Field | Value |
|---|---|
| Metric | Compute Days |
| Chart Type | Pie |
| Component | enter a regex |
| X Axis | Daily |
| Group Series By | Component |
Signature Classification
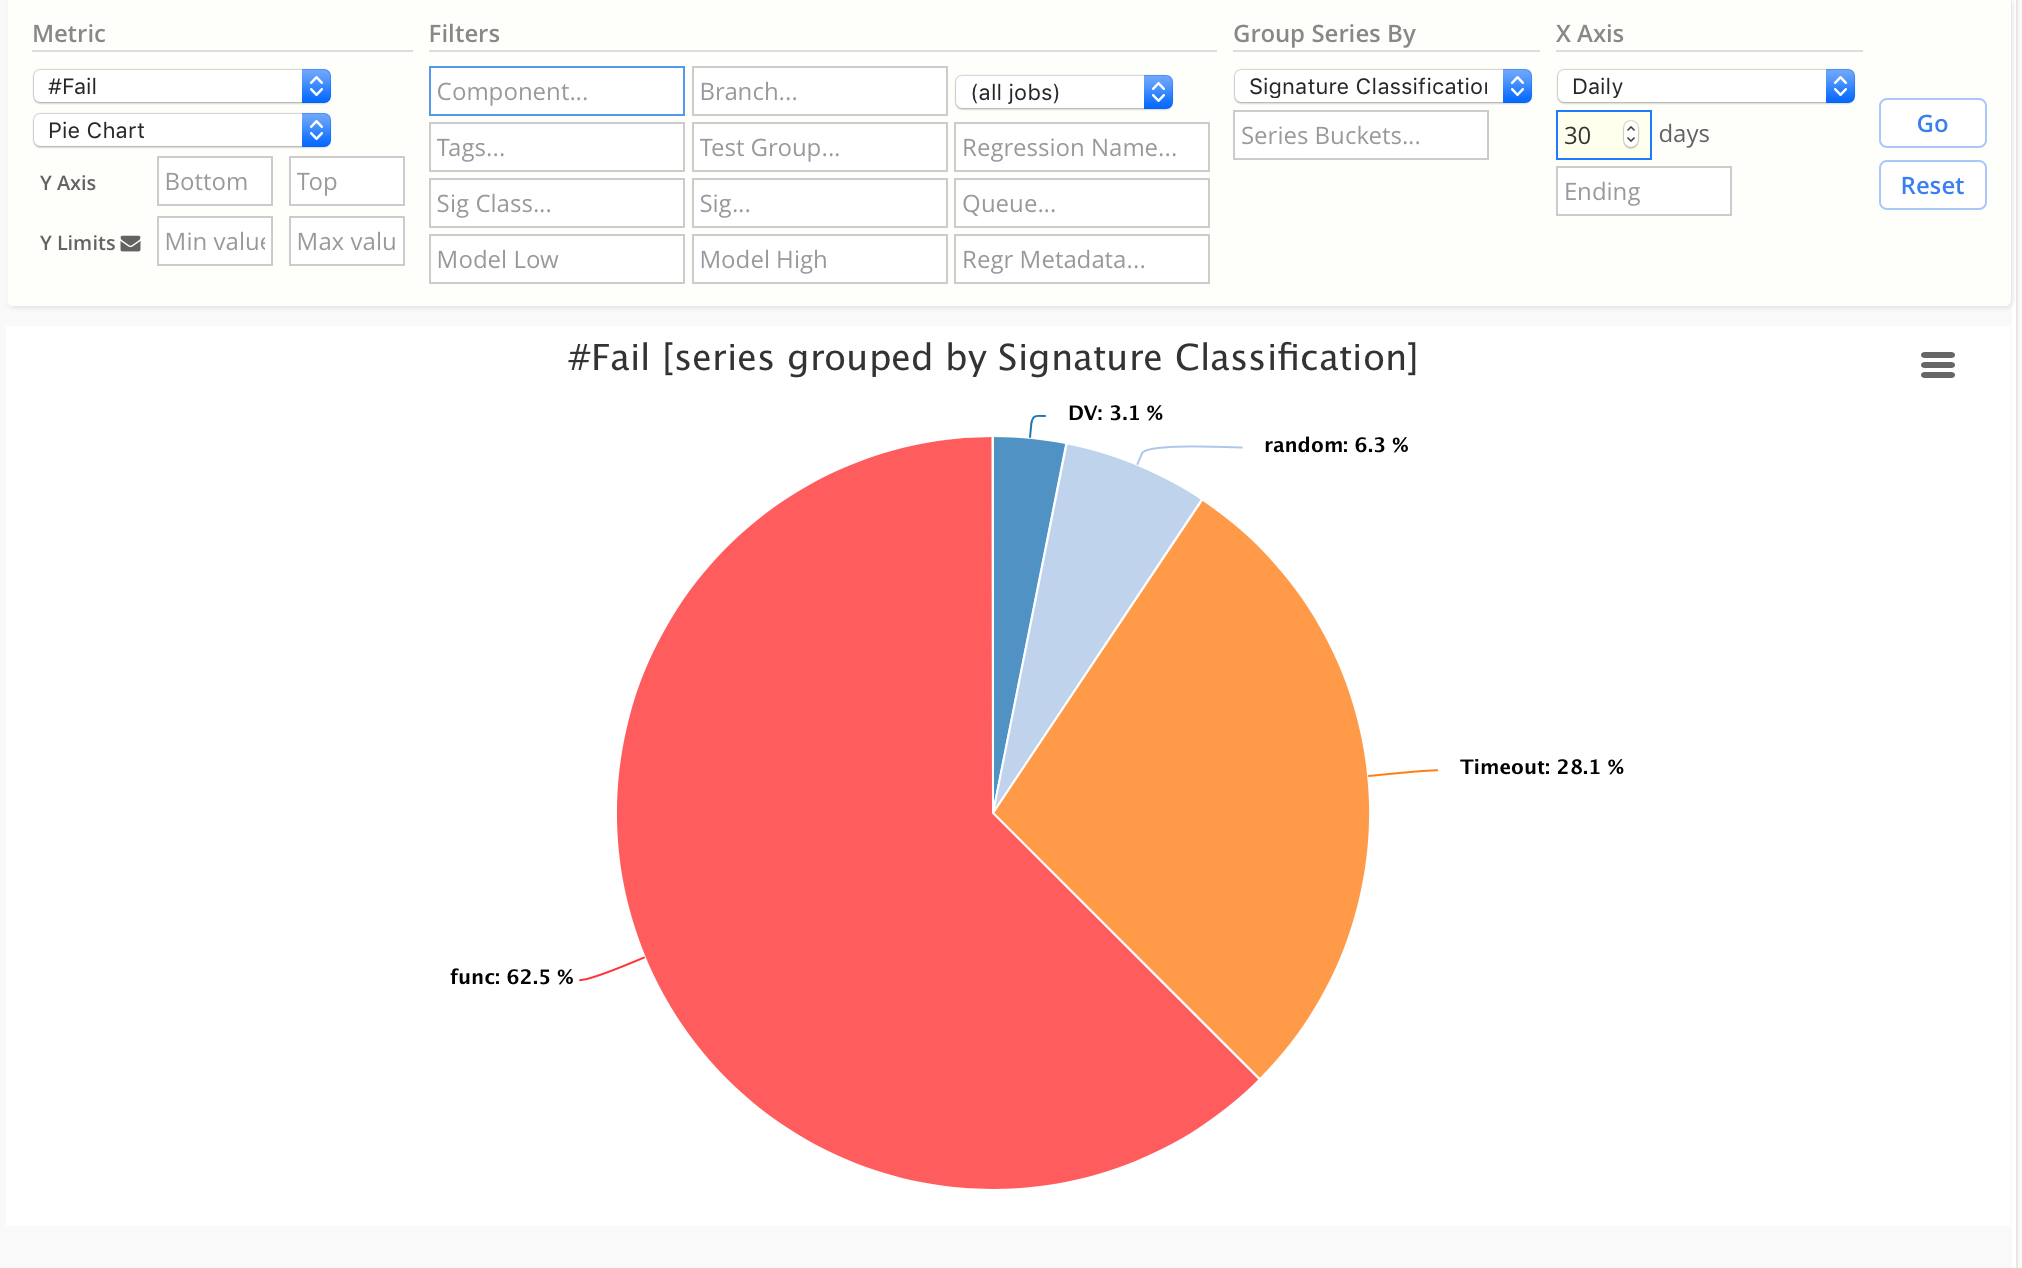
This example shows the percentage of failures for the past 30 days, grouped by Signature Classification.
Configuration:
| Chart Field | Value |
|---|---|
| Metric | #Fail |
| Chart Type | Pie |
| X Axis | Daily |
| Group Series By | Signature Classification |
Signature Triage State
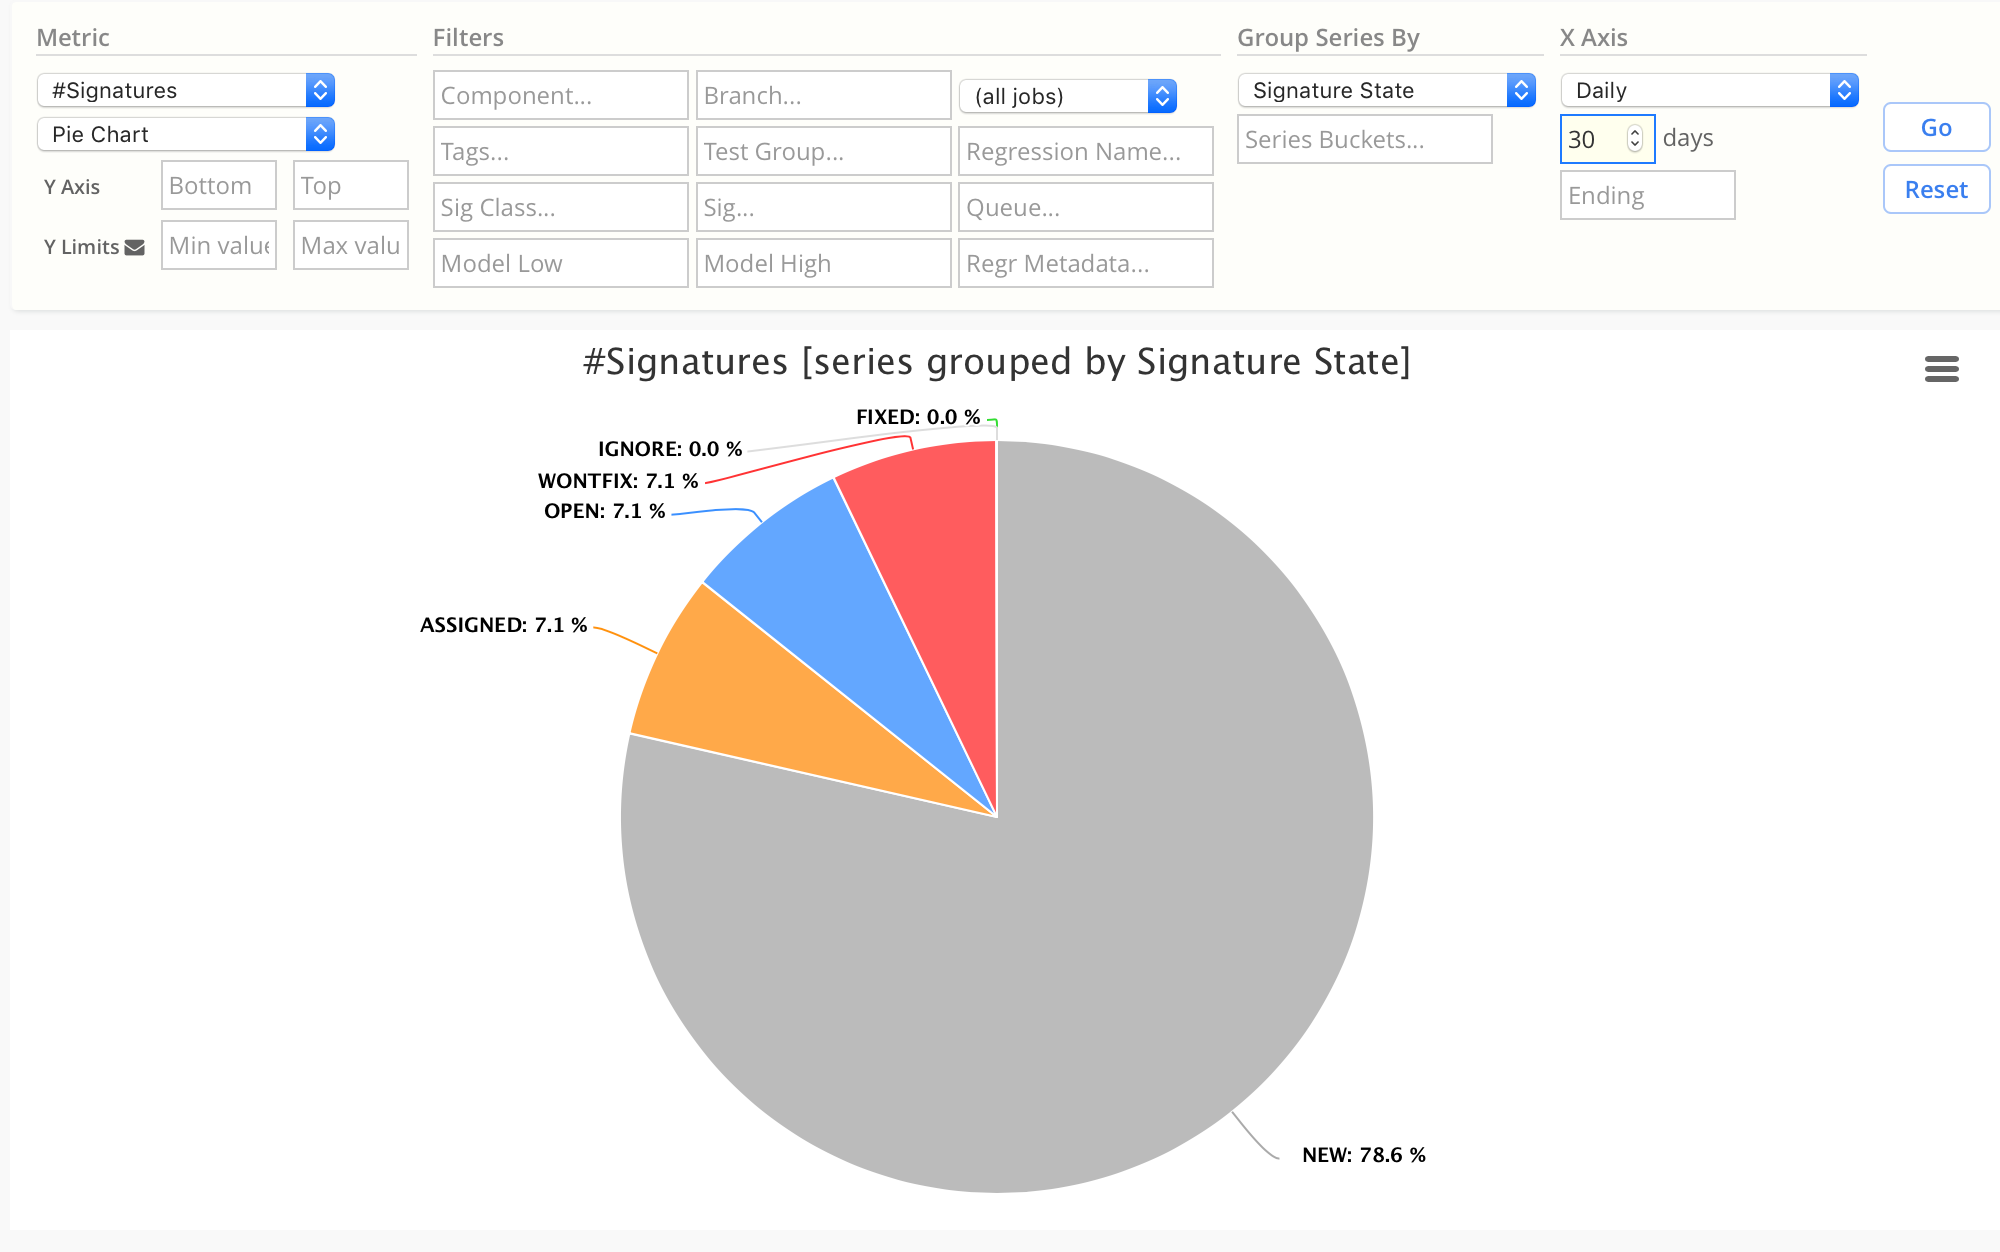
This chart shows the percentage of signatures, grouped by their Triage State, for the past 30 days.
78.6%are NEW7.1%are ASSIGNED- etc.
Configuration:
| Chart Field | Value |
|---|---|
| Metric | #Signatures |
| Chart Type | Pie |
| X Axis | Daily |
| Group Series By | Signature State |
Pie chart with custom series groups
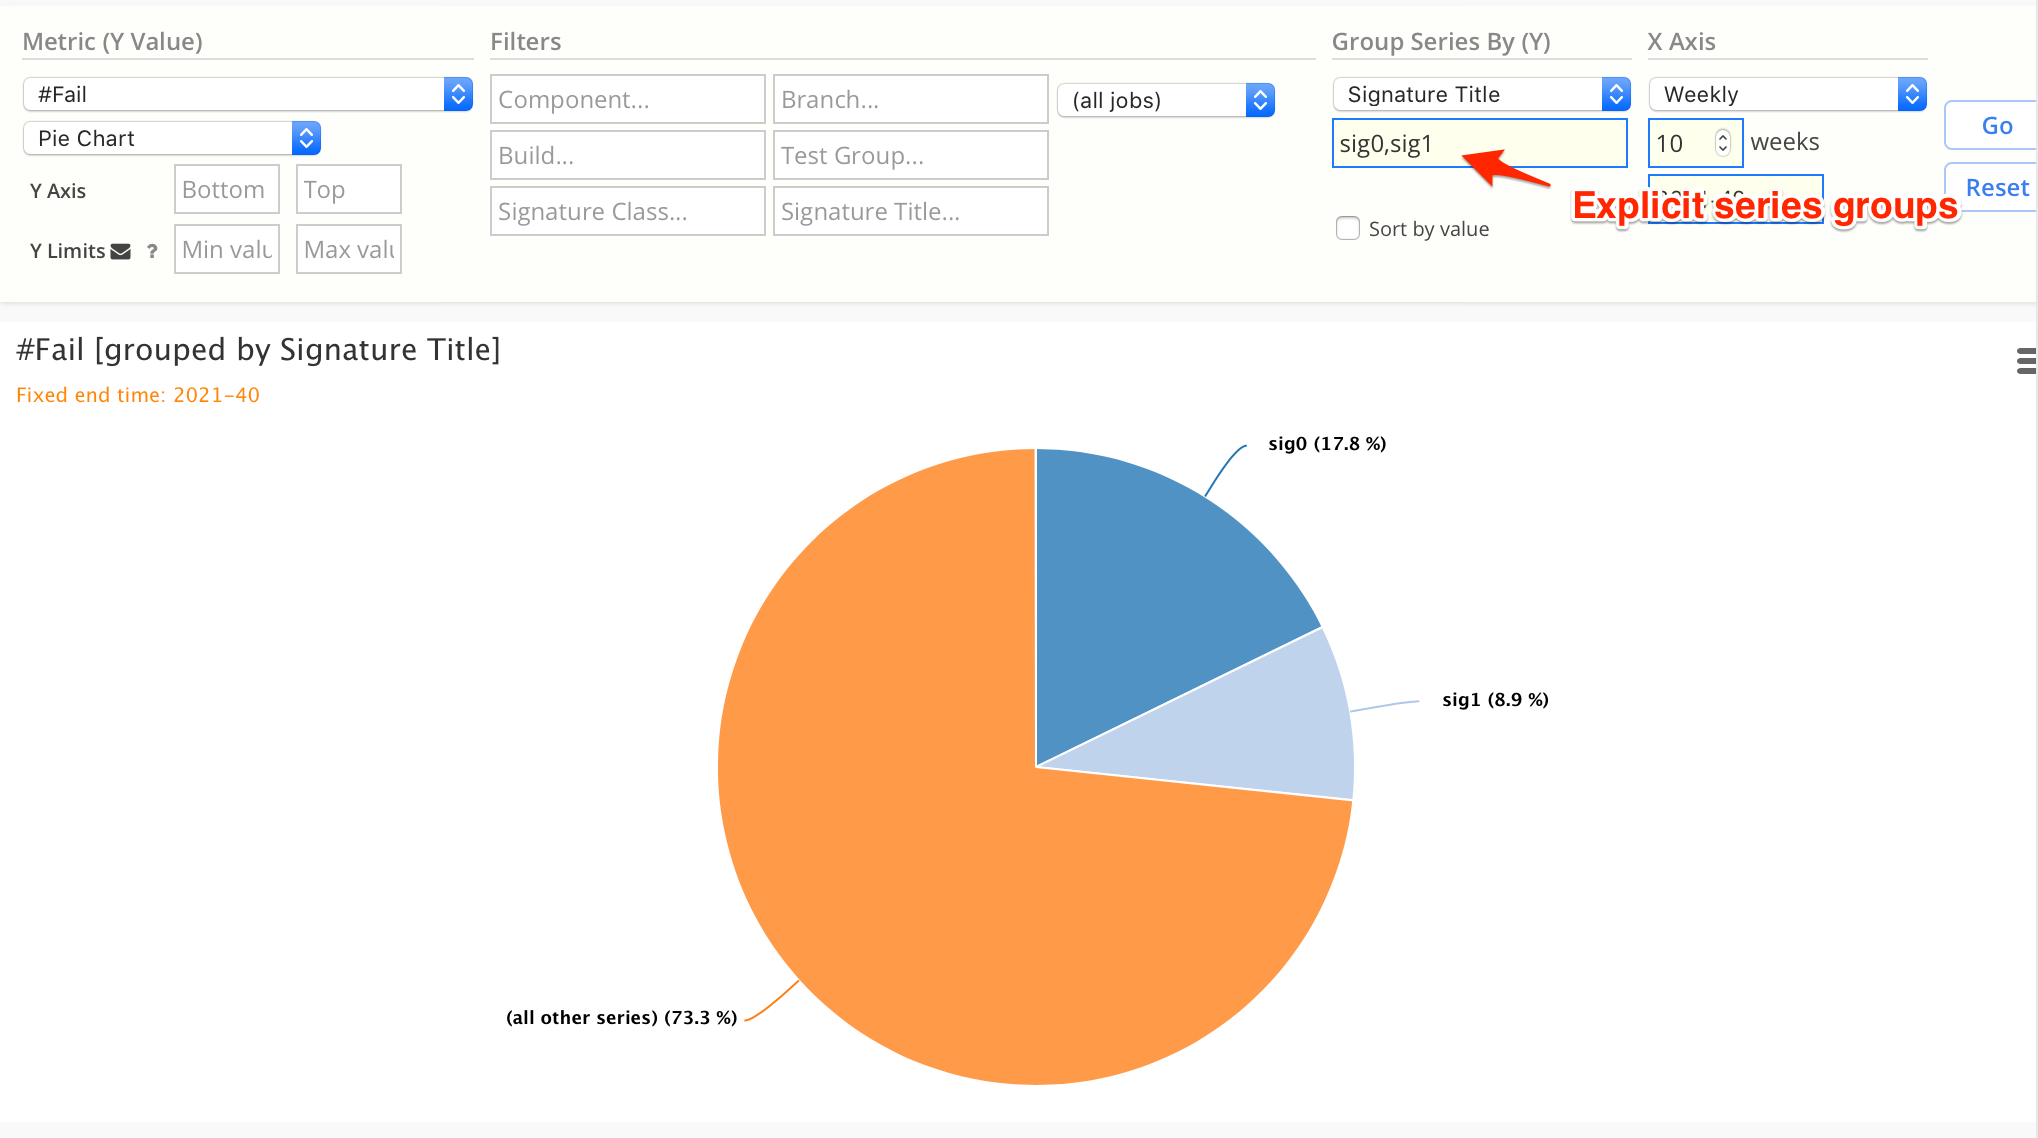
This chart shows the number of fails per Signature for the past 10 weeks, with 2 custom series groups:
sig0sig1(all other series)is an automatic series group, to match the remaining signatures.
Note that the groups are ordered as pie slices, in a clockwise direction, beginning at top of the pie.
Configuration:
| Chart Field | Value |
|---|---|
| Metric | #Fail |
| Chart Type | Pie |
| X Axis | Weekly (or could be daily) |
| Group Series By | Signature Title |
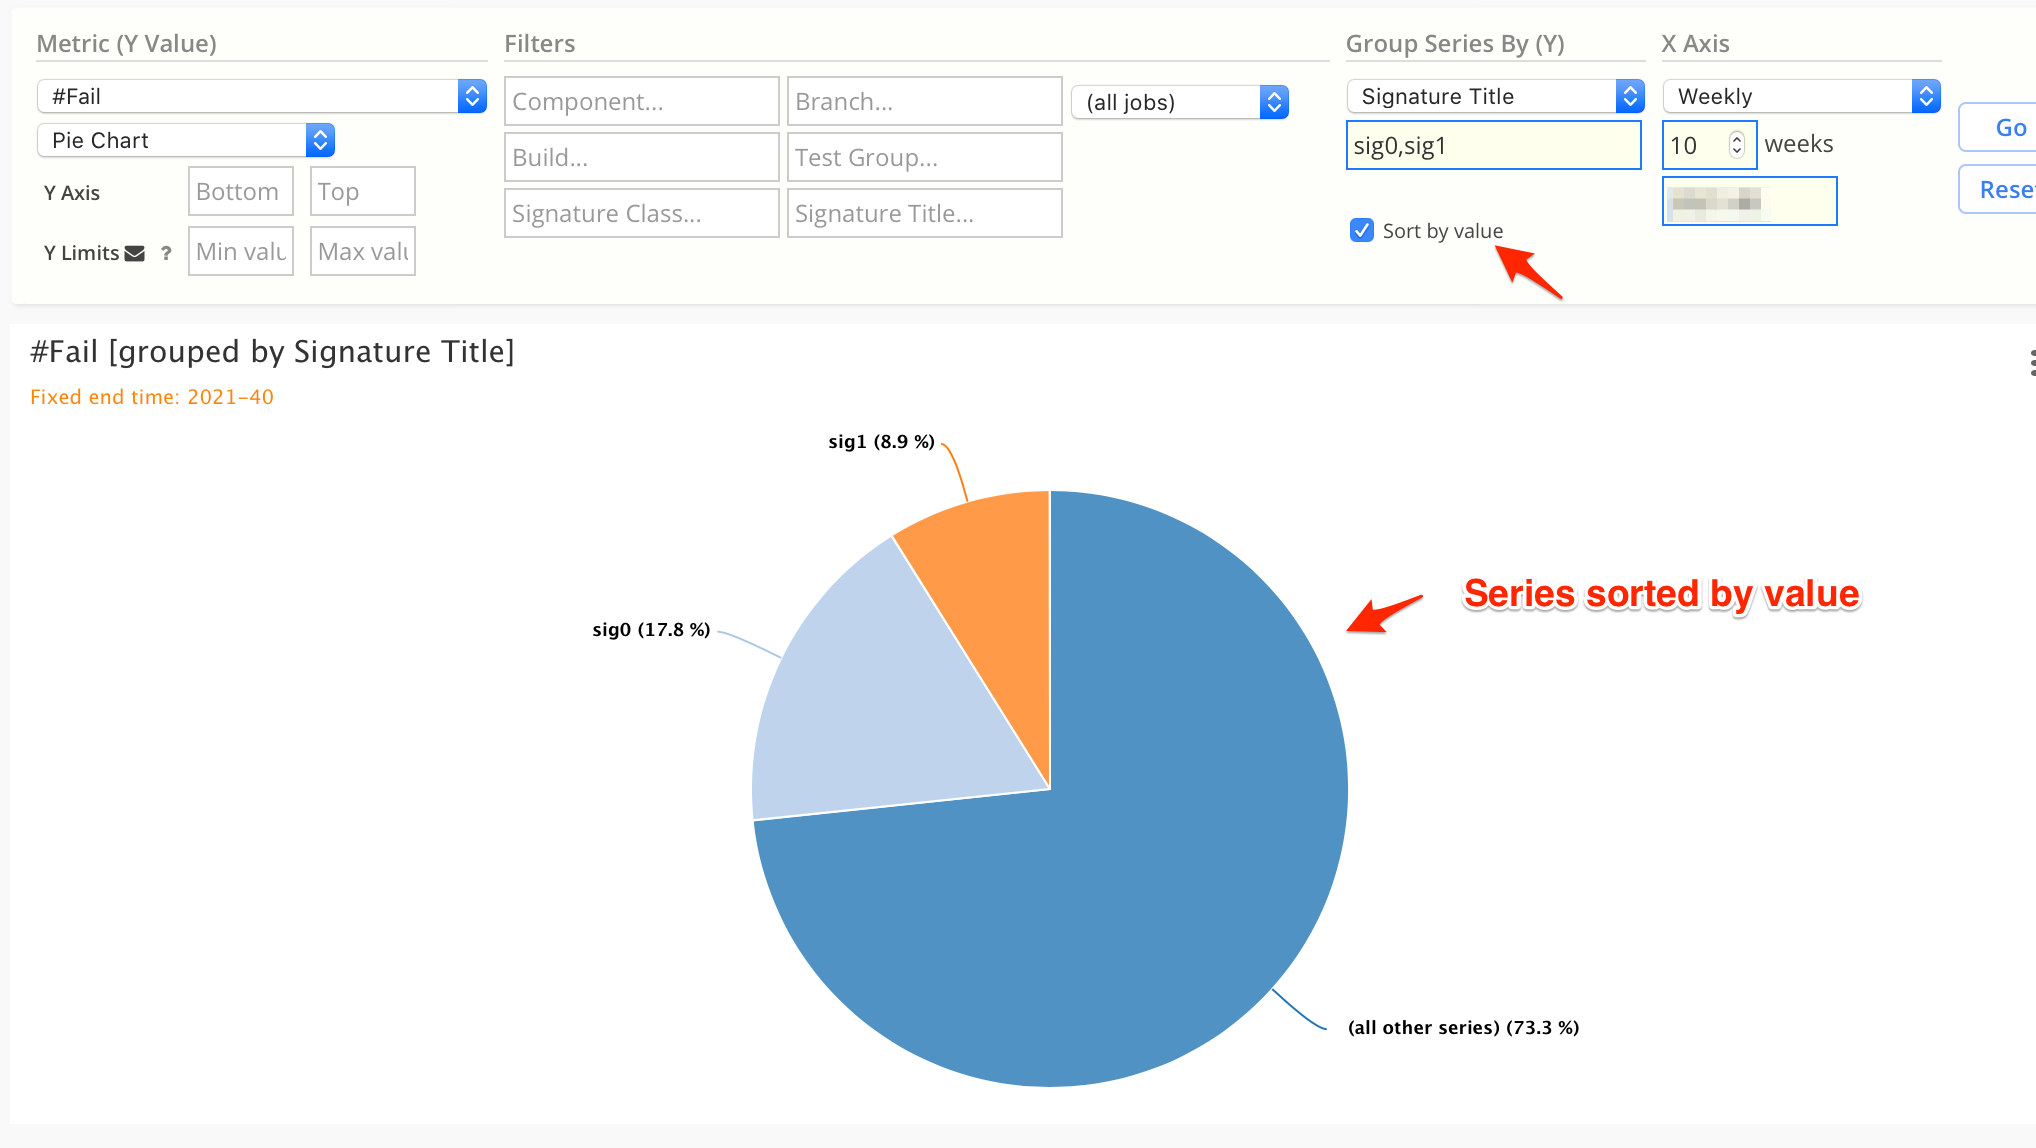
Pie chart with custom series groups, sorted by value
This pie chart is identical to the above Pie chart, except the Sort by value checkbox has been clicked.
- Note the pie slices are ordered by value (in descending order), in a clockwise direction around the pie.
