Regression Job Histogram
The Regression Job Histogram is a visual display of job count frequency based on a variety of job-based fields:
- Runtime
- Cycles
- CPS
- Any Job Metadata:
- Examples:
transactions,peak_memory,disk_usage,latency, etc.
- Examples:
This feature allows plotting of job metadata within a single regression.
- Please contact VerOps if you want to plot across regressions.
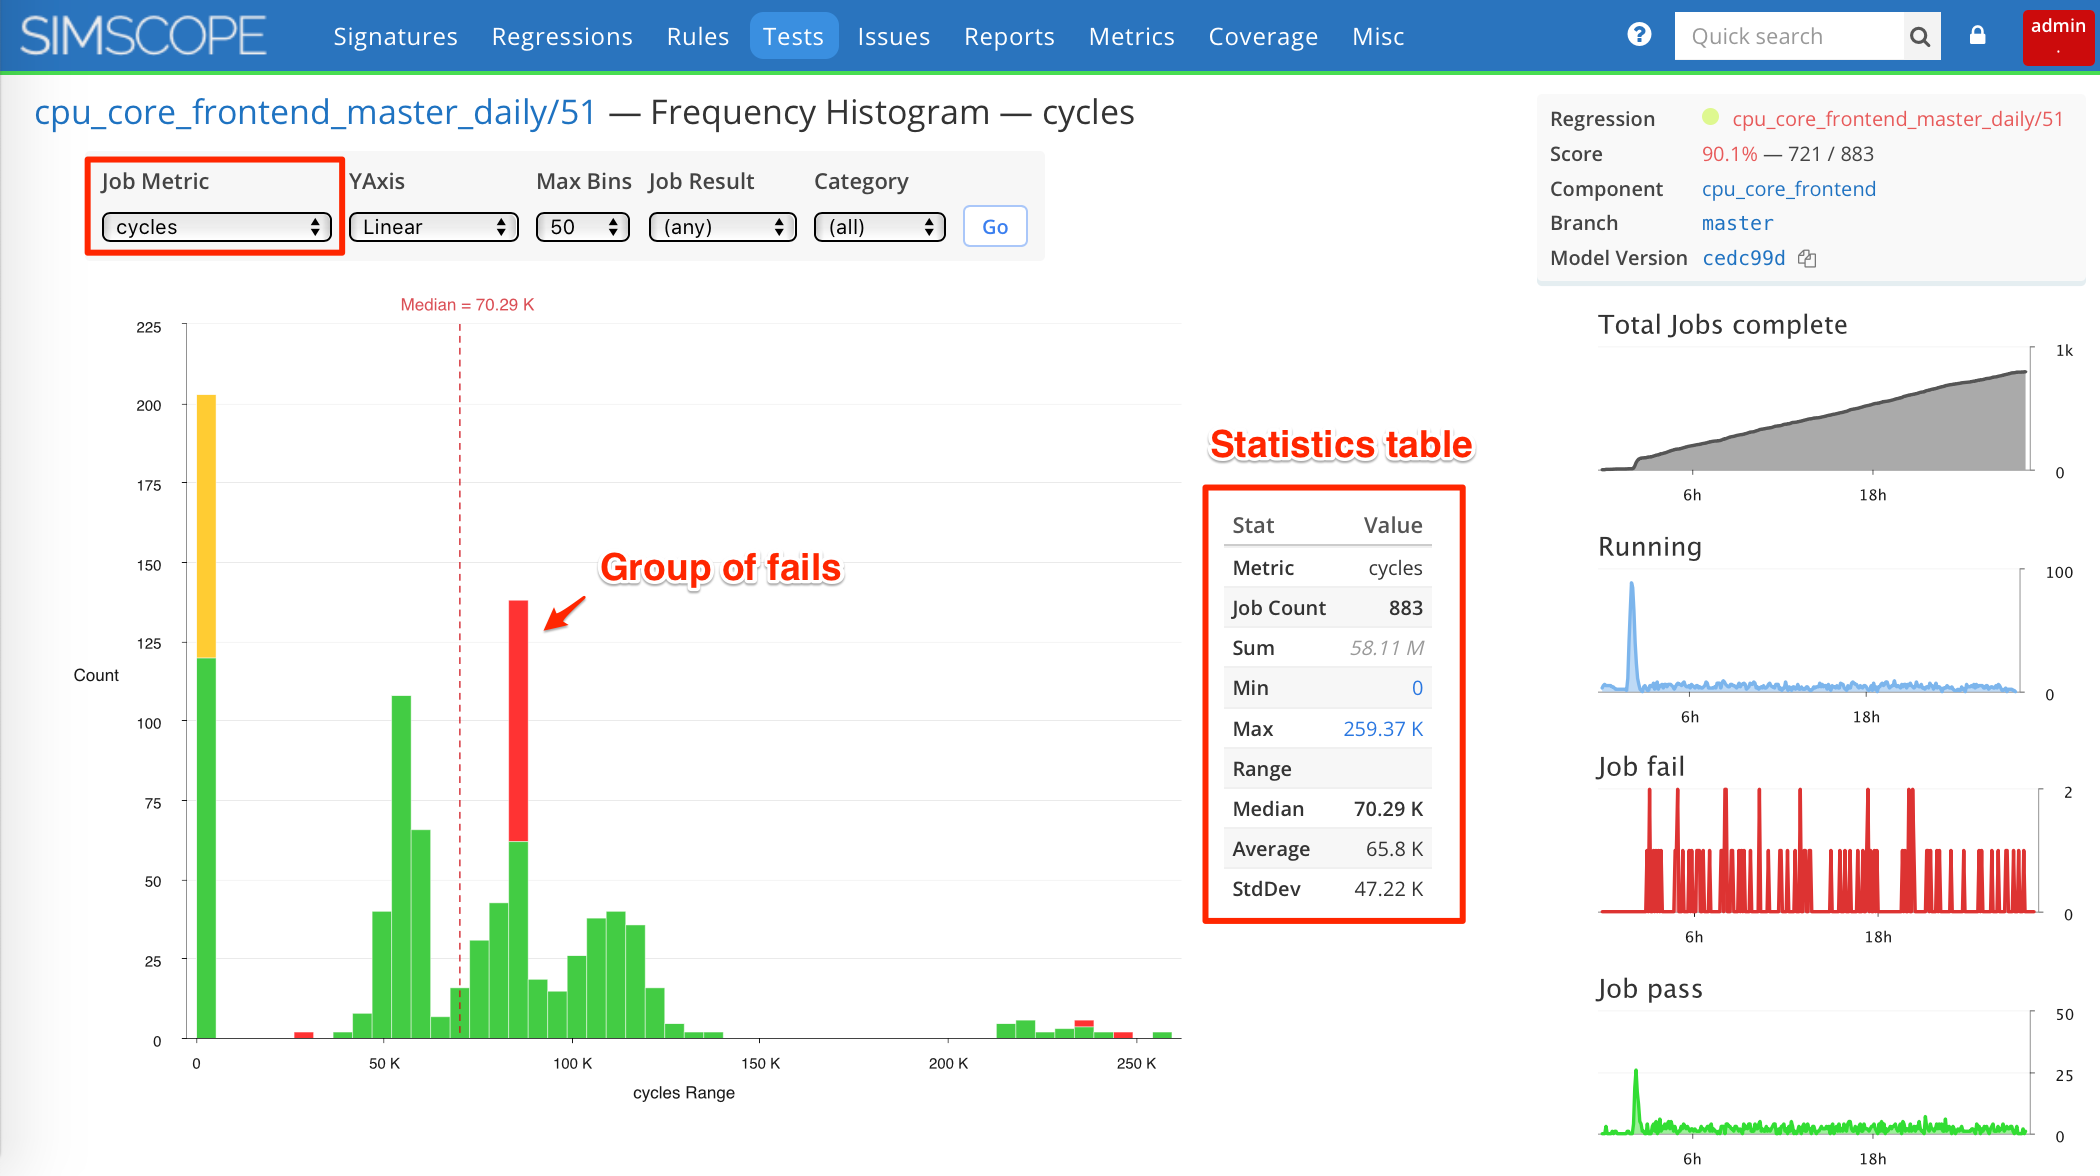
Example Cycles Histogram
This is an example histogram for a regression using cycles.
- You can see a block of failing jobs at approximately
85kcycles.
Custom Job Metadata Histogram
This is an example histogram for a regression using
custom job metadata field peak_memory_mb.
- You can see the median value is
4.54 GB.
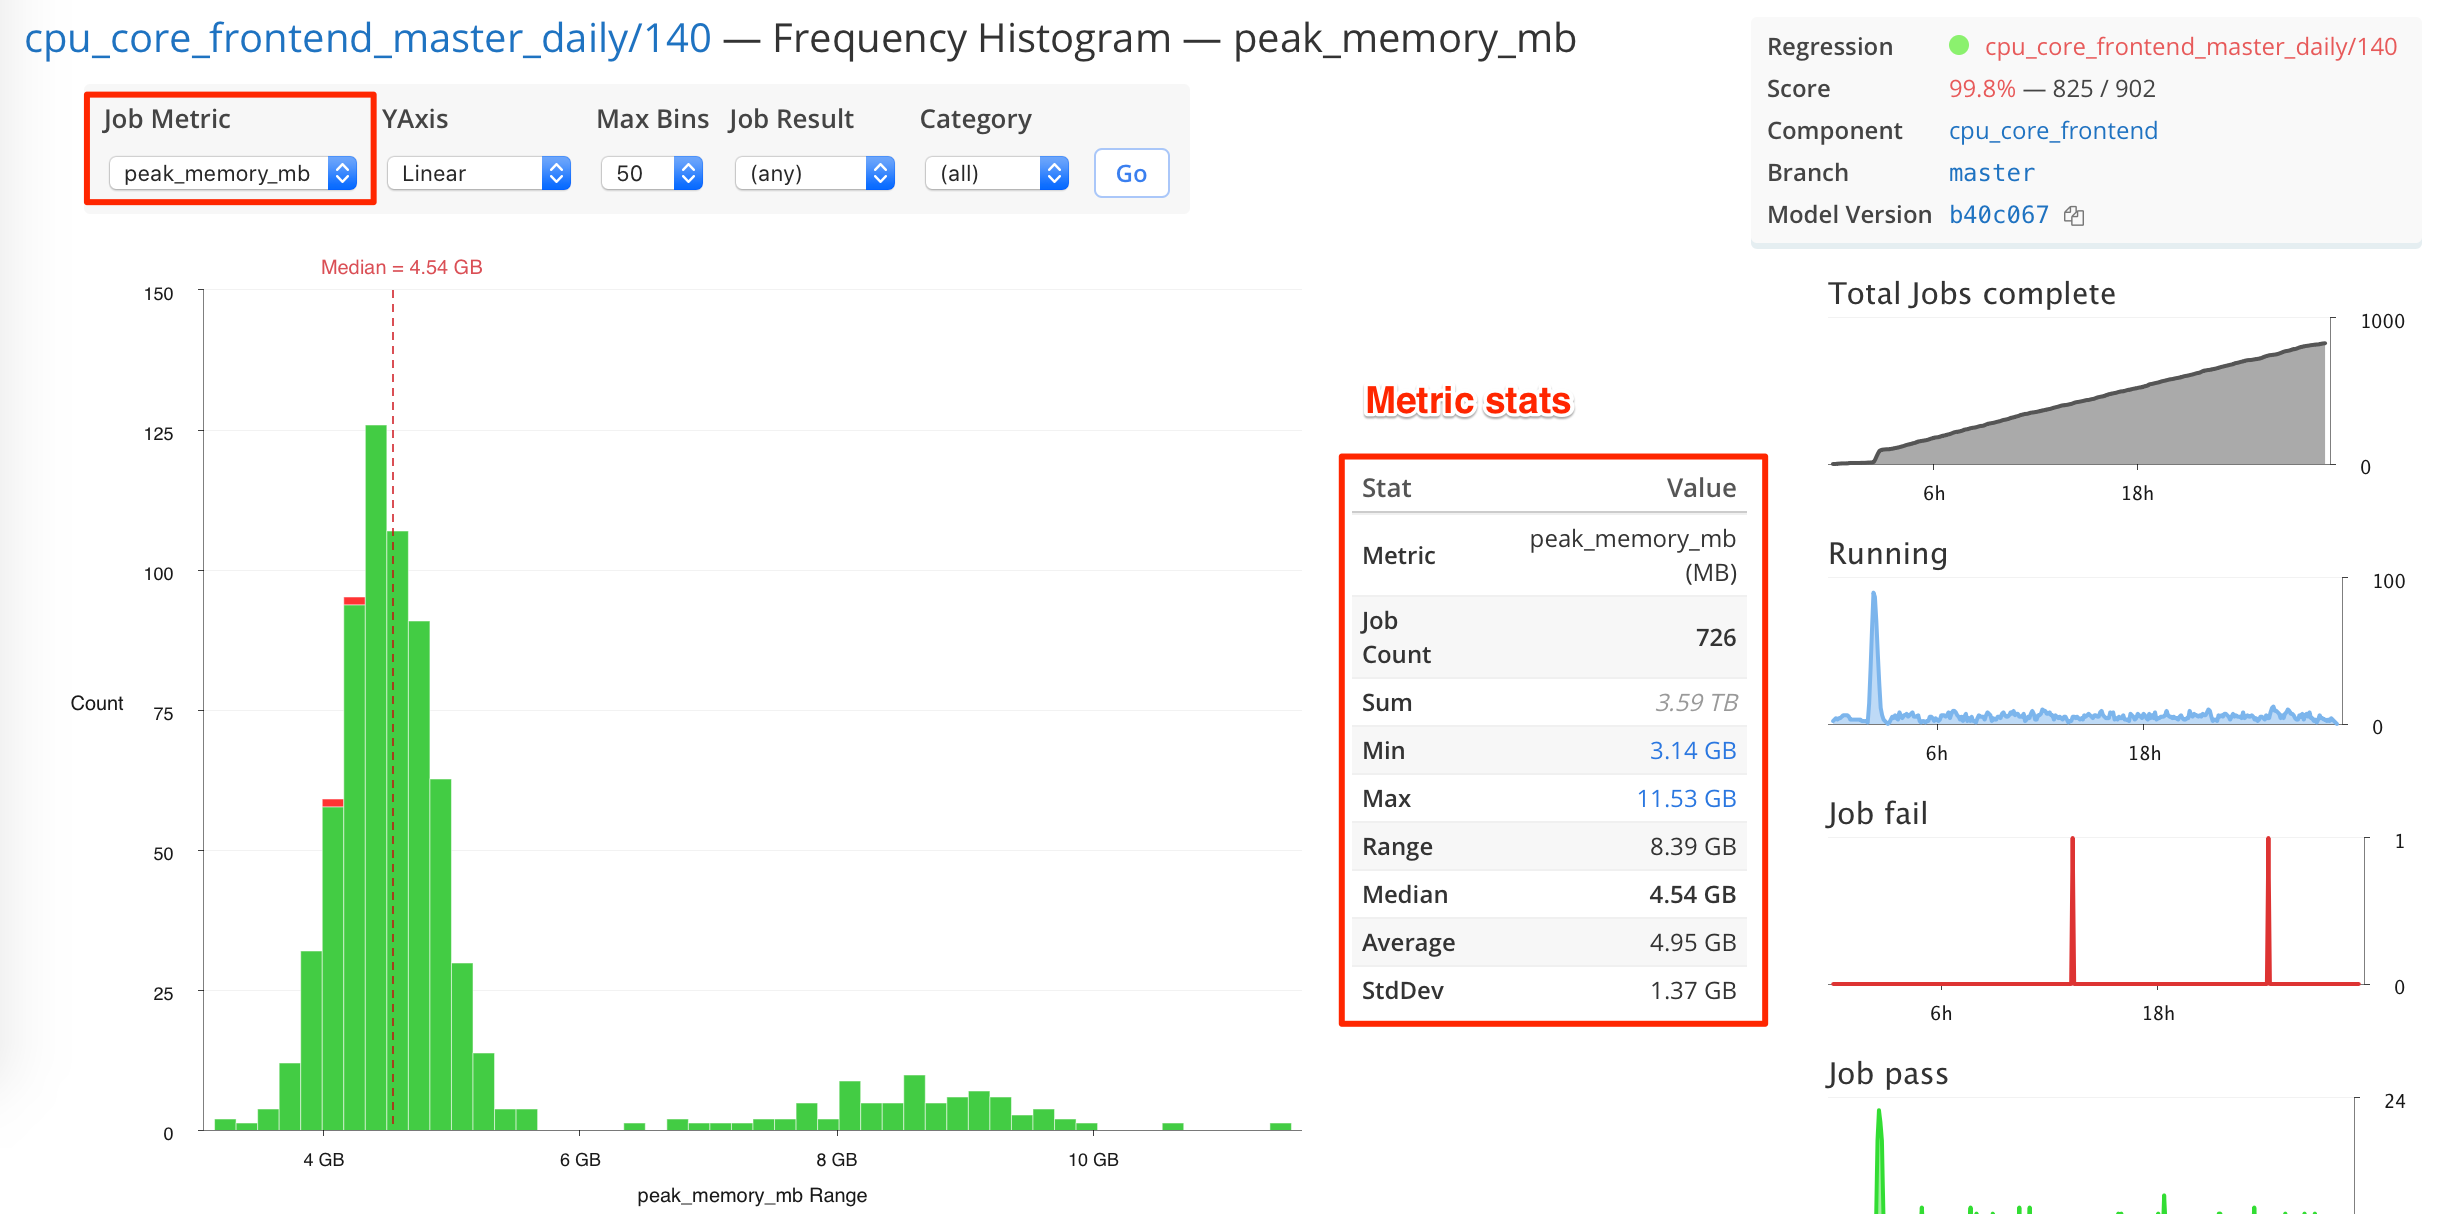
- You can see
peak_memory_mbranges from 3GB to 10.5GB, with a median of 4.5GB. - Also, there are charts of overall Launch/Finish metrics on the right side of the page.
Clickable Histogram Bins
For debugging purposes, Histogram Bins can be clicked, to drilldown into a list of jobs within the bin.
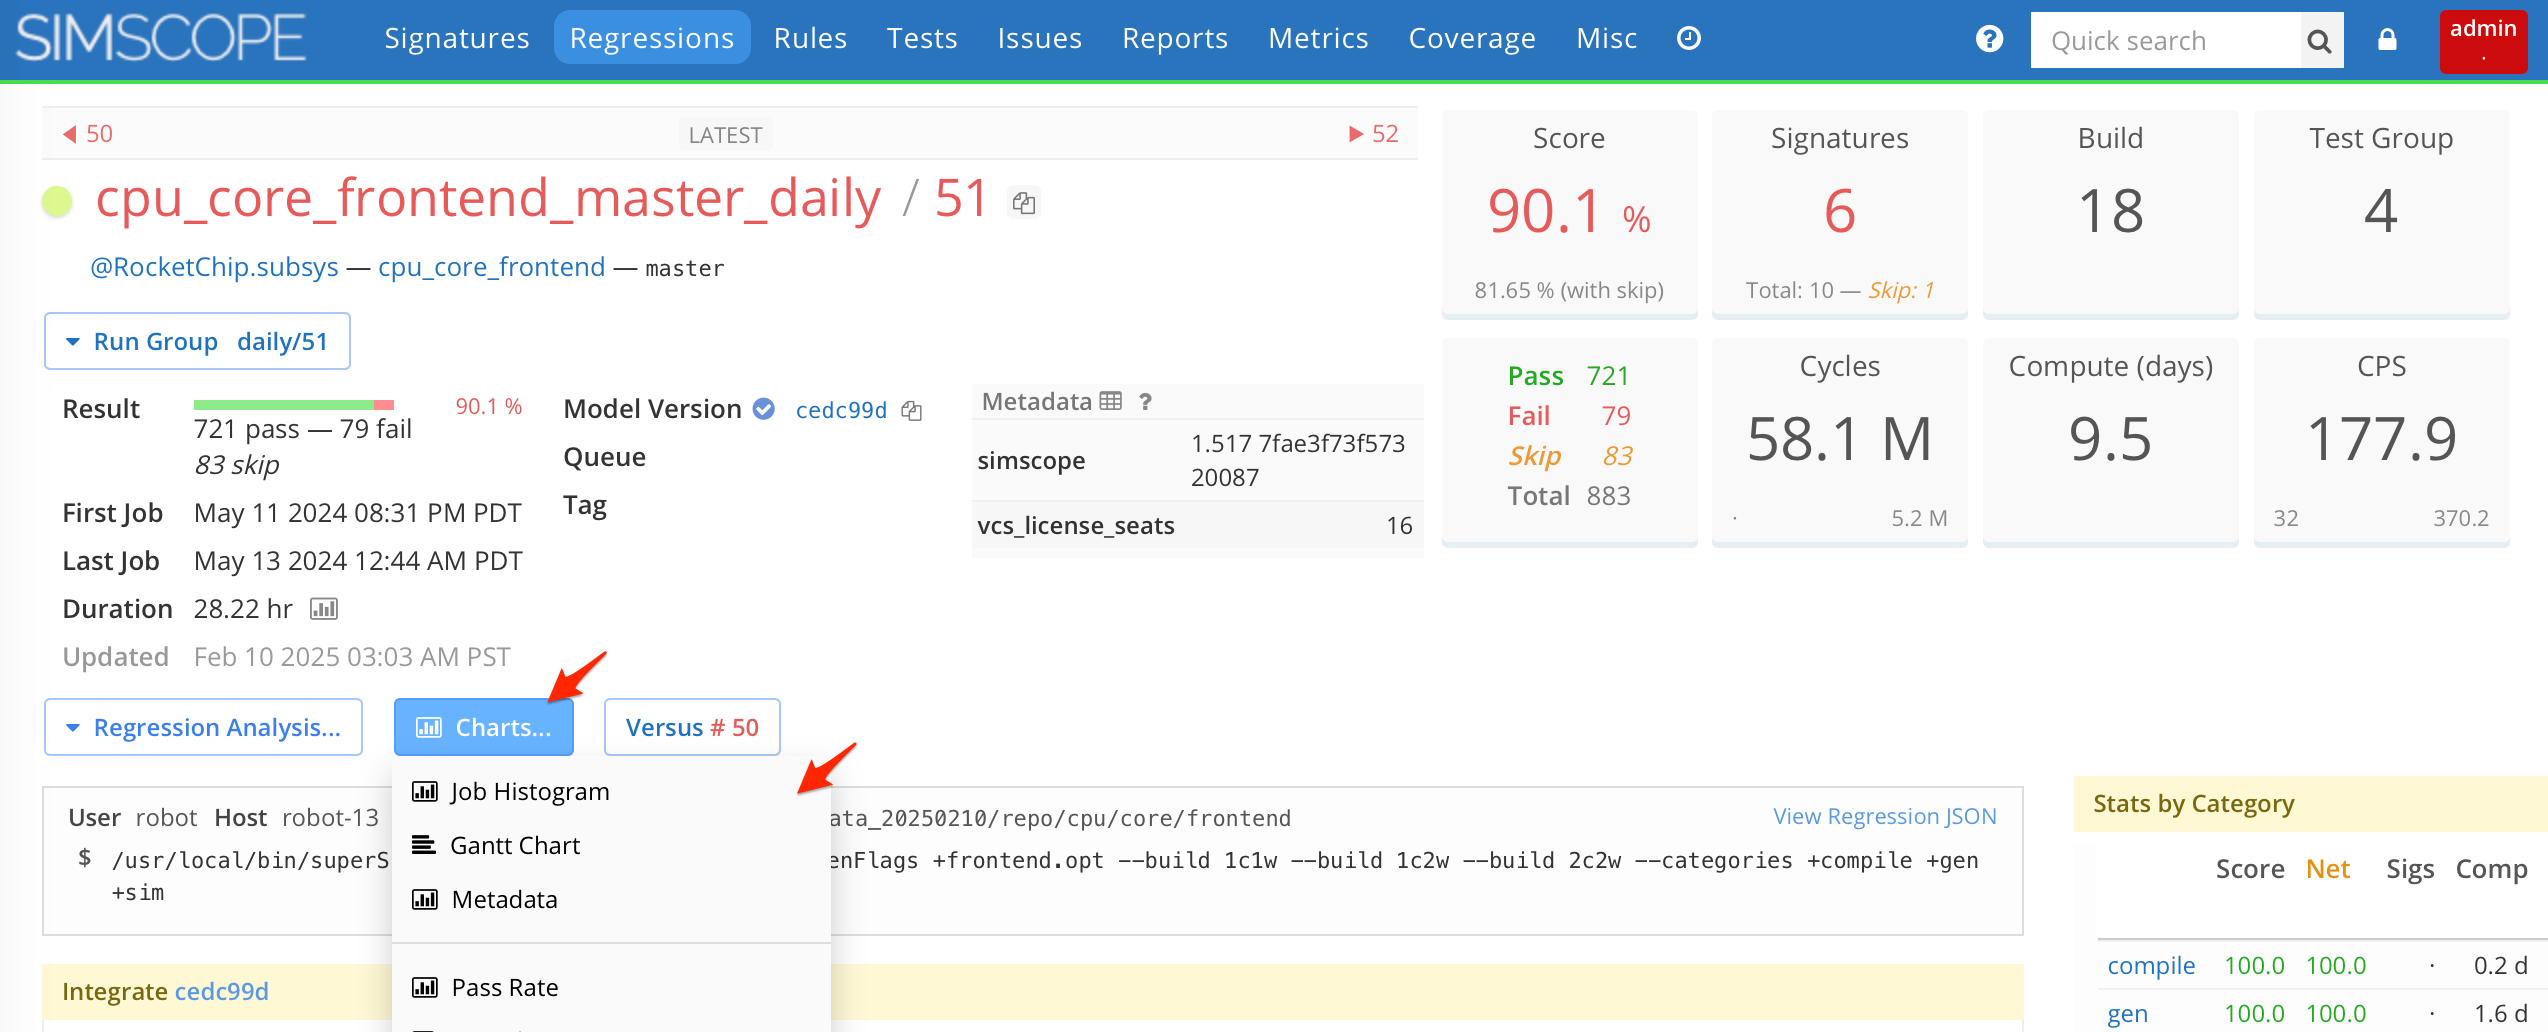
Accessing the Histogram
To access the histogram:
- Go to any Regression Details page.
- Hover over the Charts button.
- Click the Job Histogram link.
See the screenshot below:
Statistics Table
For the chosen metric, the Statistics Table displays:
- Total jobs
- Min value (with a hyperlink to the job)
- Max value (with a hyperlink to the job)
- Average
- Median
- Range (Max-Min)
- Standard Deviation
Regression Launch Metric Charts
The Regression Launch Charts (on the right side of the Histogram page) enable viewing of jobs launching and finishing across a regression duration.
This enables viewing how many jobs are running in parallel, and how many lagging jobs are running.
See also Gantt Chart.