Bar Charts
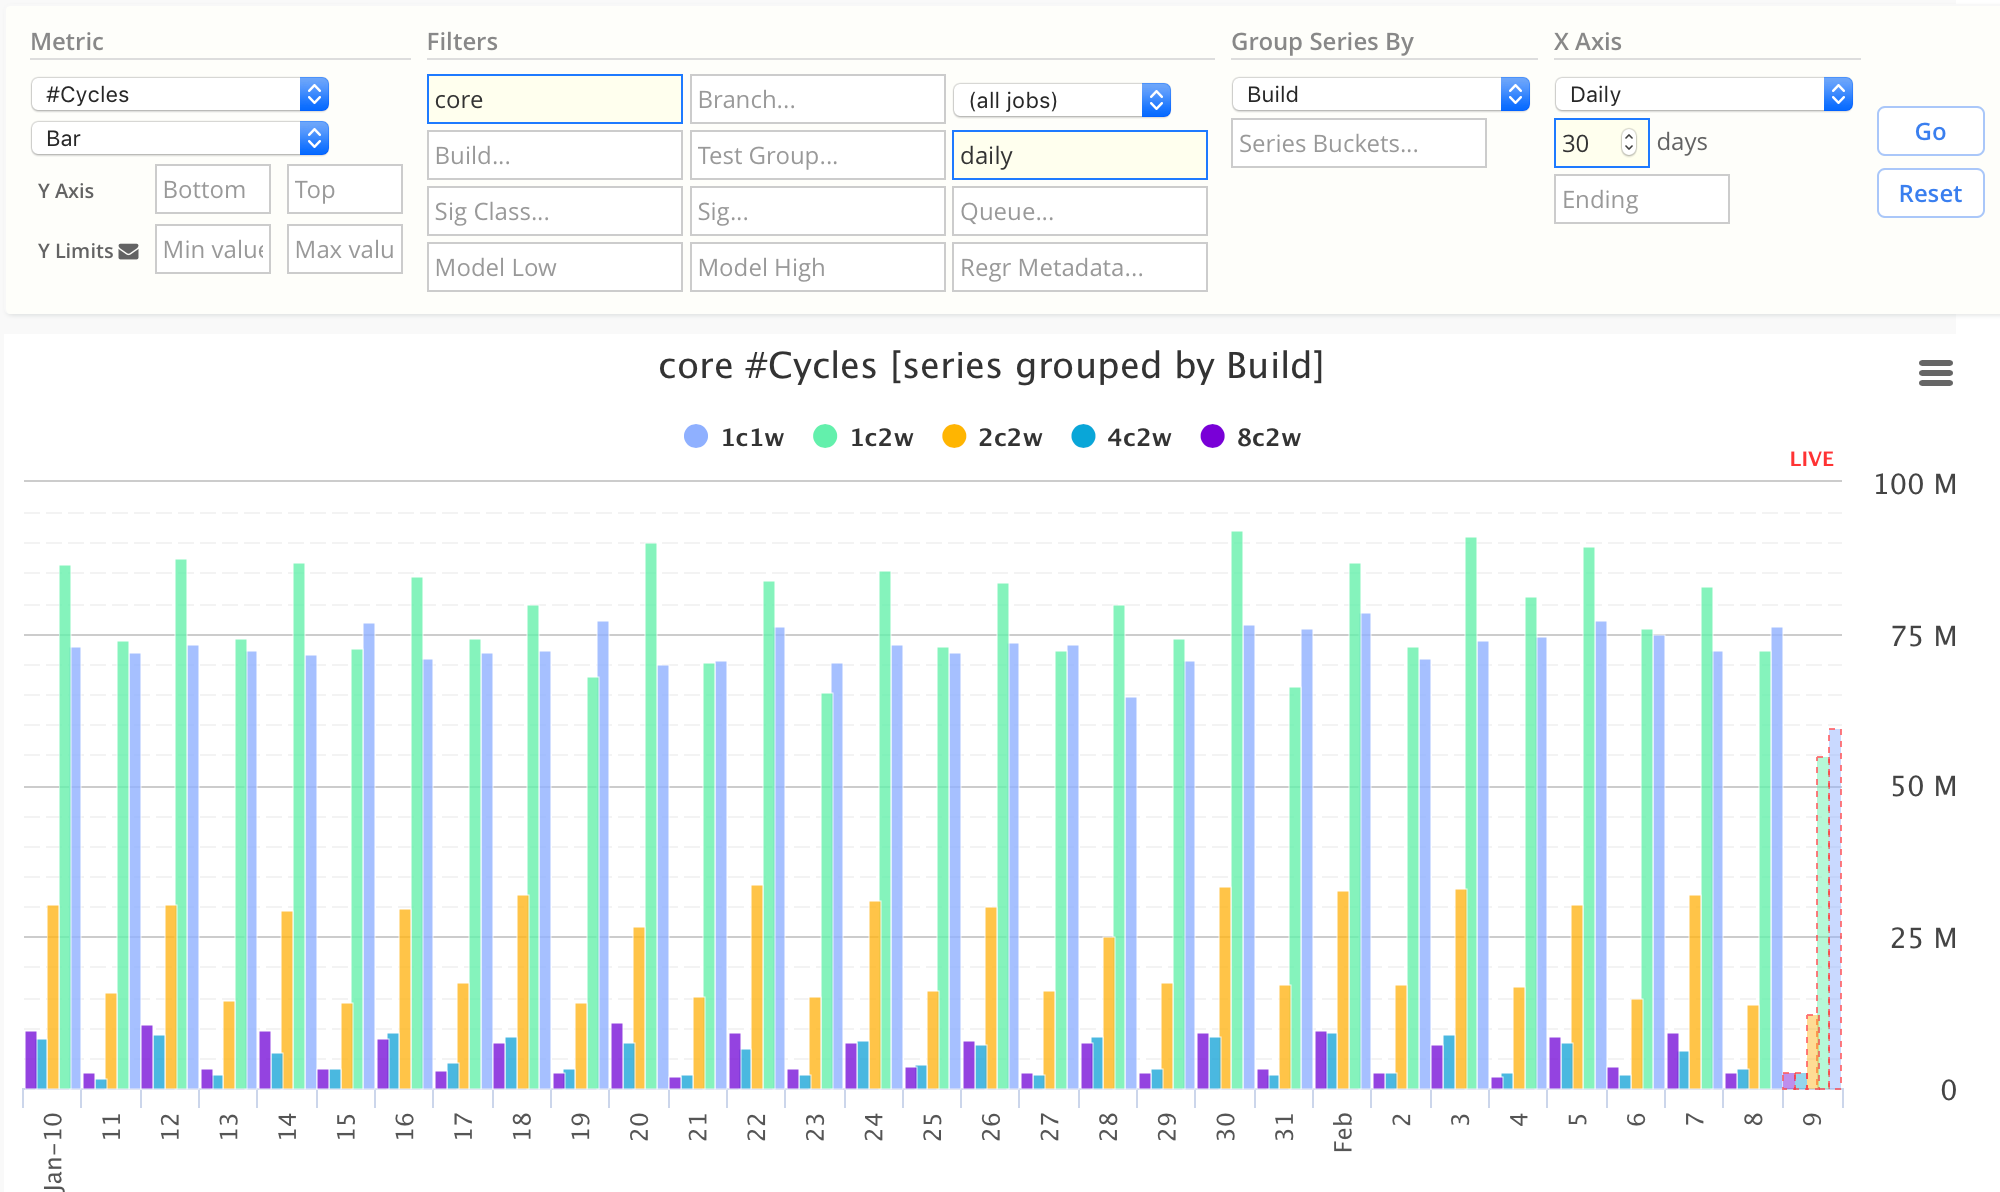
Bar (ie column chart)
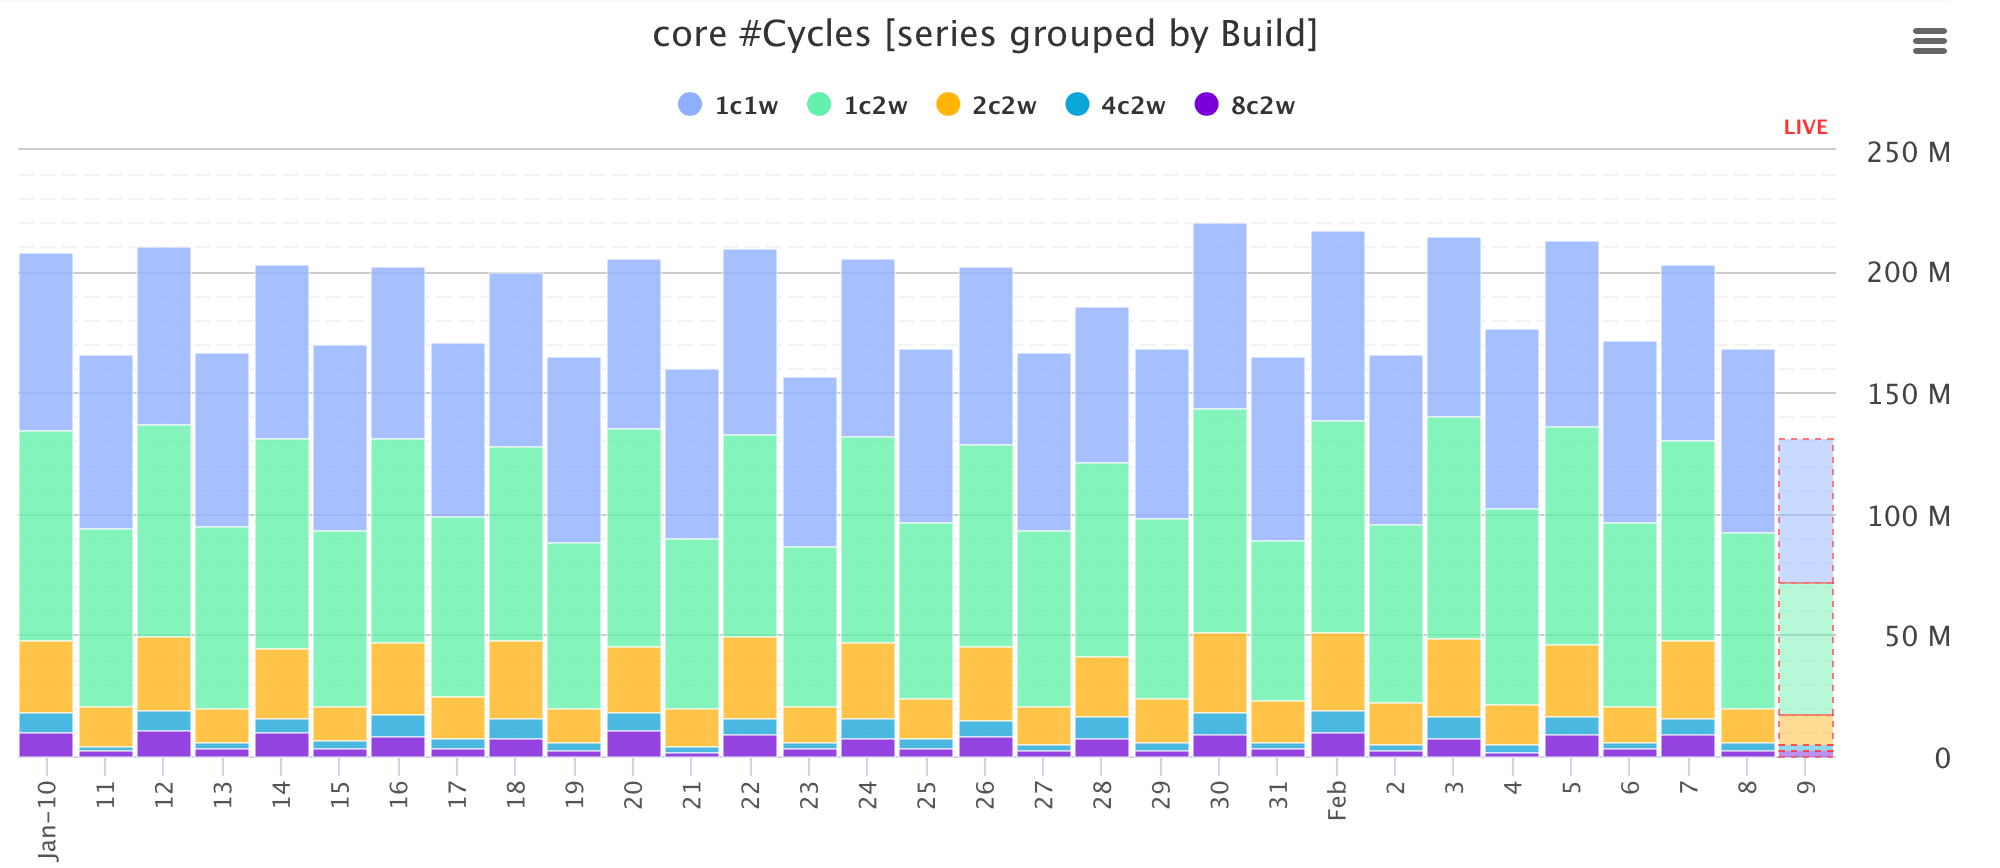
Stacked Bar
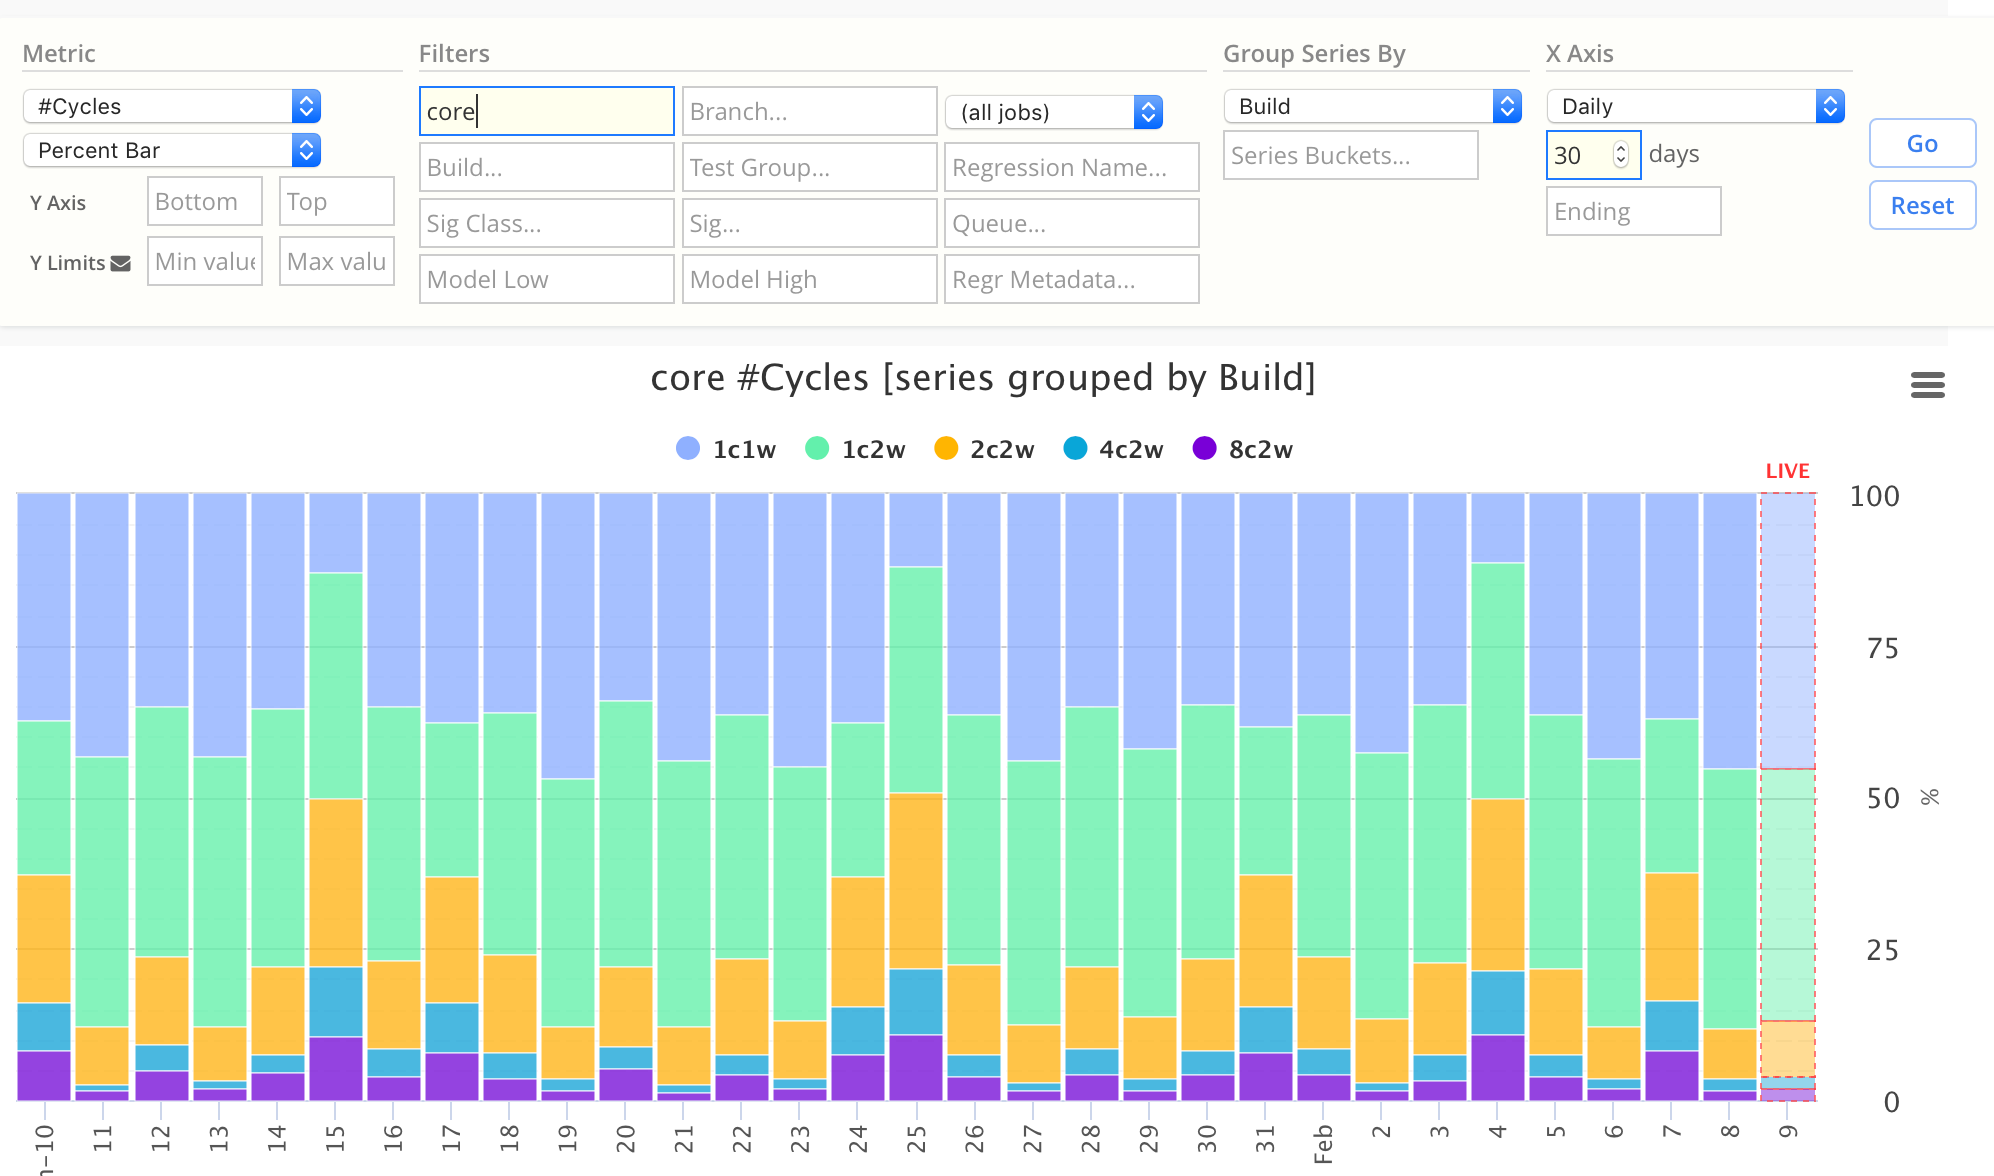
Percent Bar
This is the same as Stacked Bar chart, except each Y value is normalized to a 100% total.
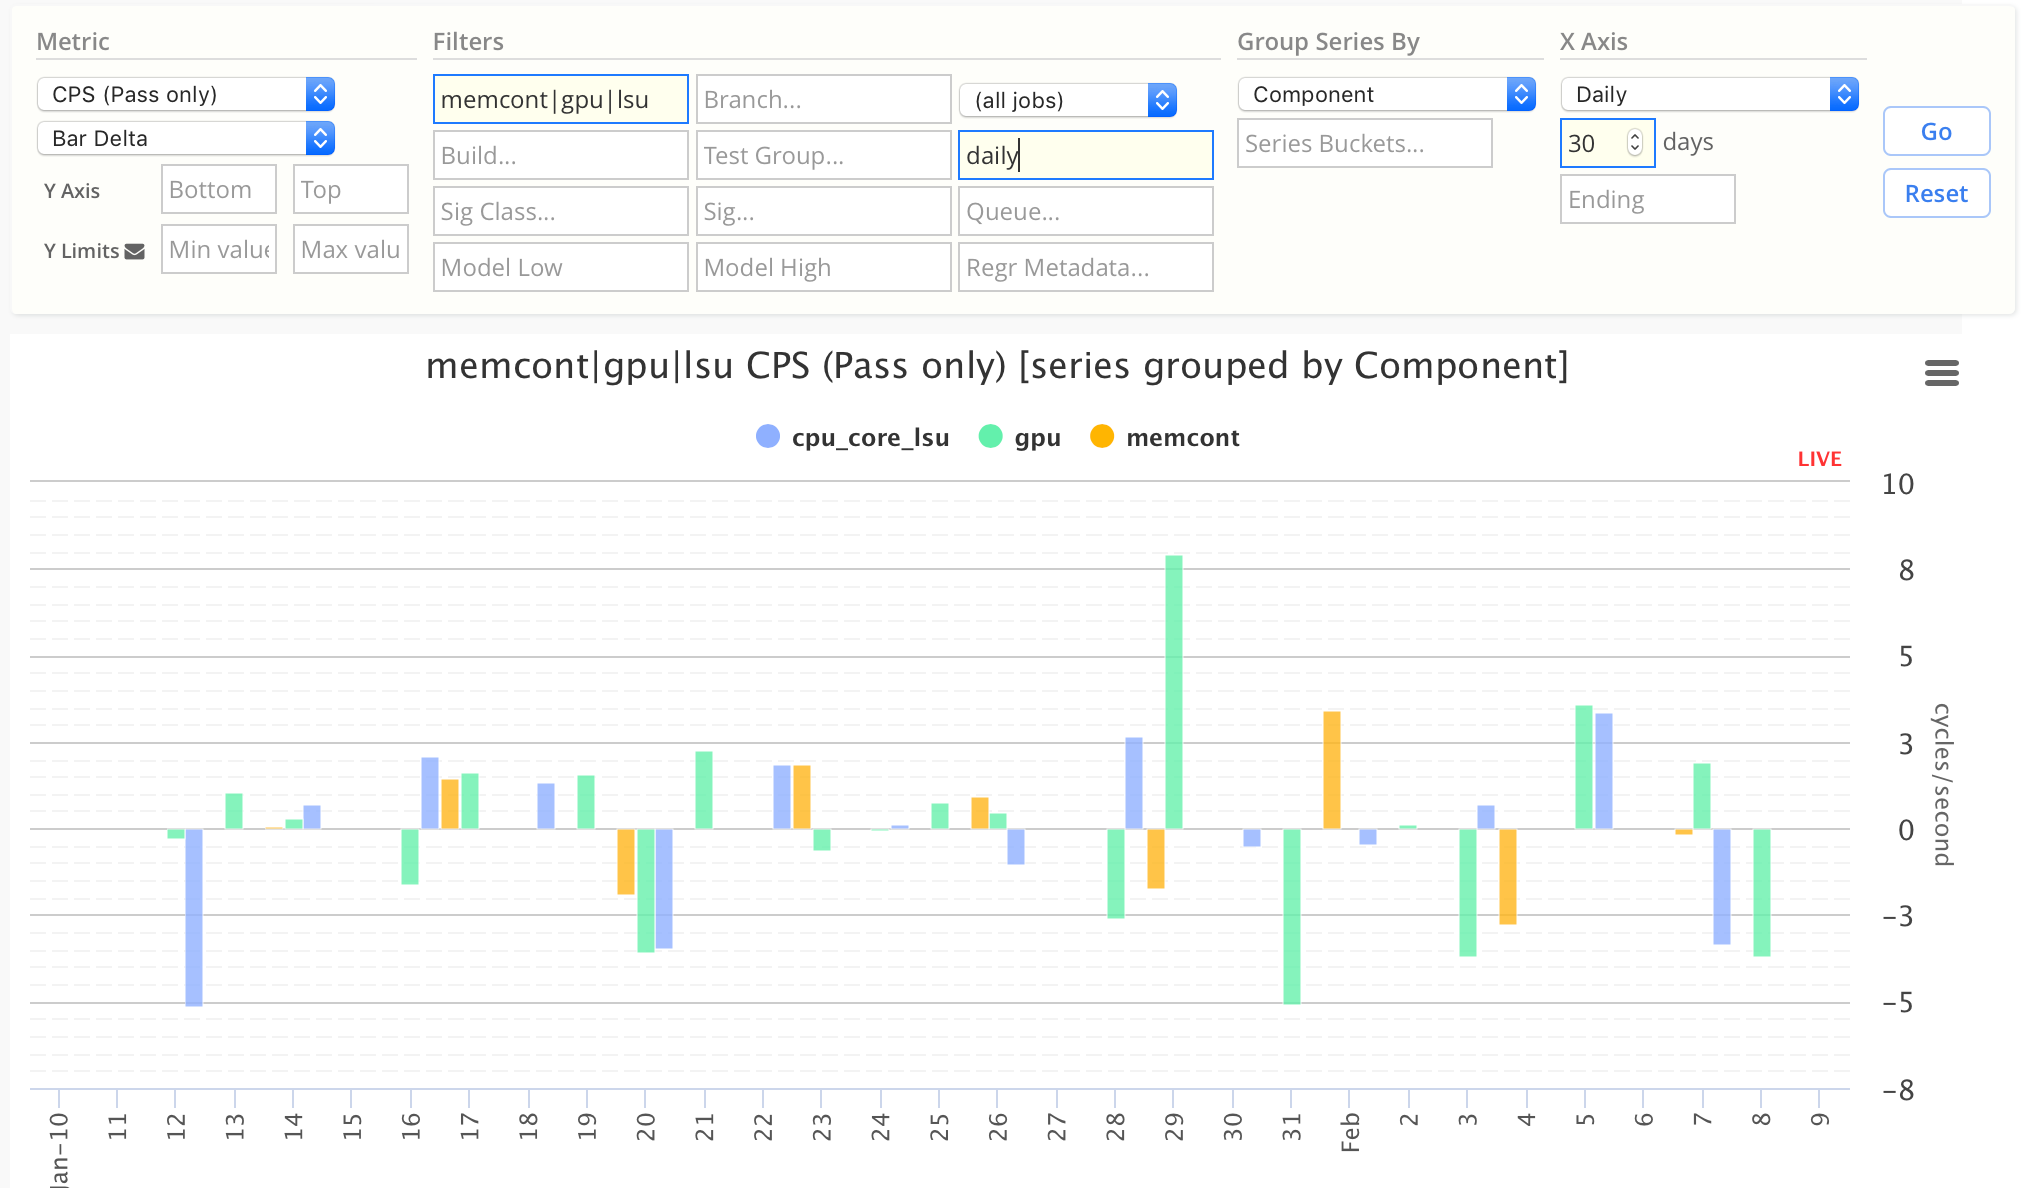
Bar Delta
Bar Delta is a derivative chart, where each time segment value is the delta from the prior value. This is useful to show small changes
For example, if we have this CPS data:
| Date | CPS |
|---|---|
| Jan 1 | 10 |
| Jan 2 | 12 |
| Jan 3 | 12.1 |
| Jan 4 | 11.9 |
Then a Bar Delta chart would render the daily changes:
| Date | CPS |
|---|---|
| Jan 2 | 2 |
| Jan 3 | 0.1 |
| Jan 3 | -0.2 |
This is useful for generating delta charts, like "Daily Change in CPS".
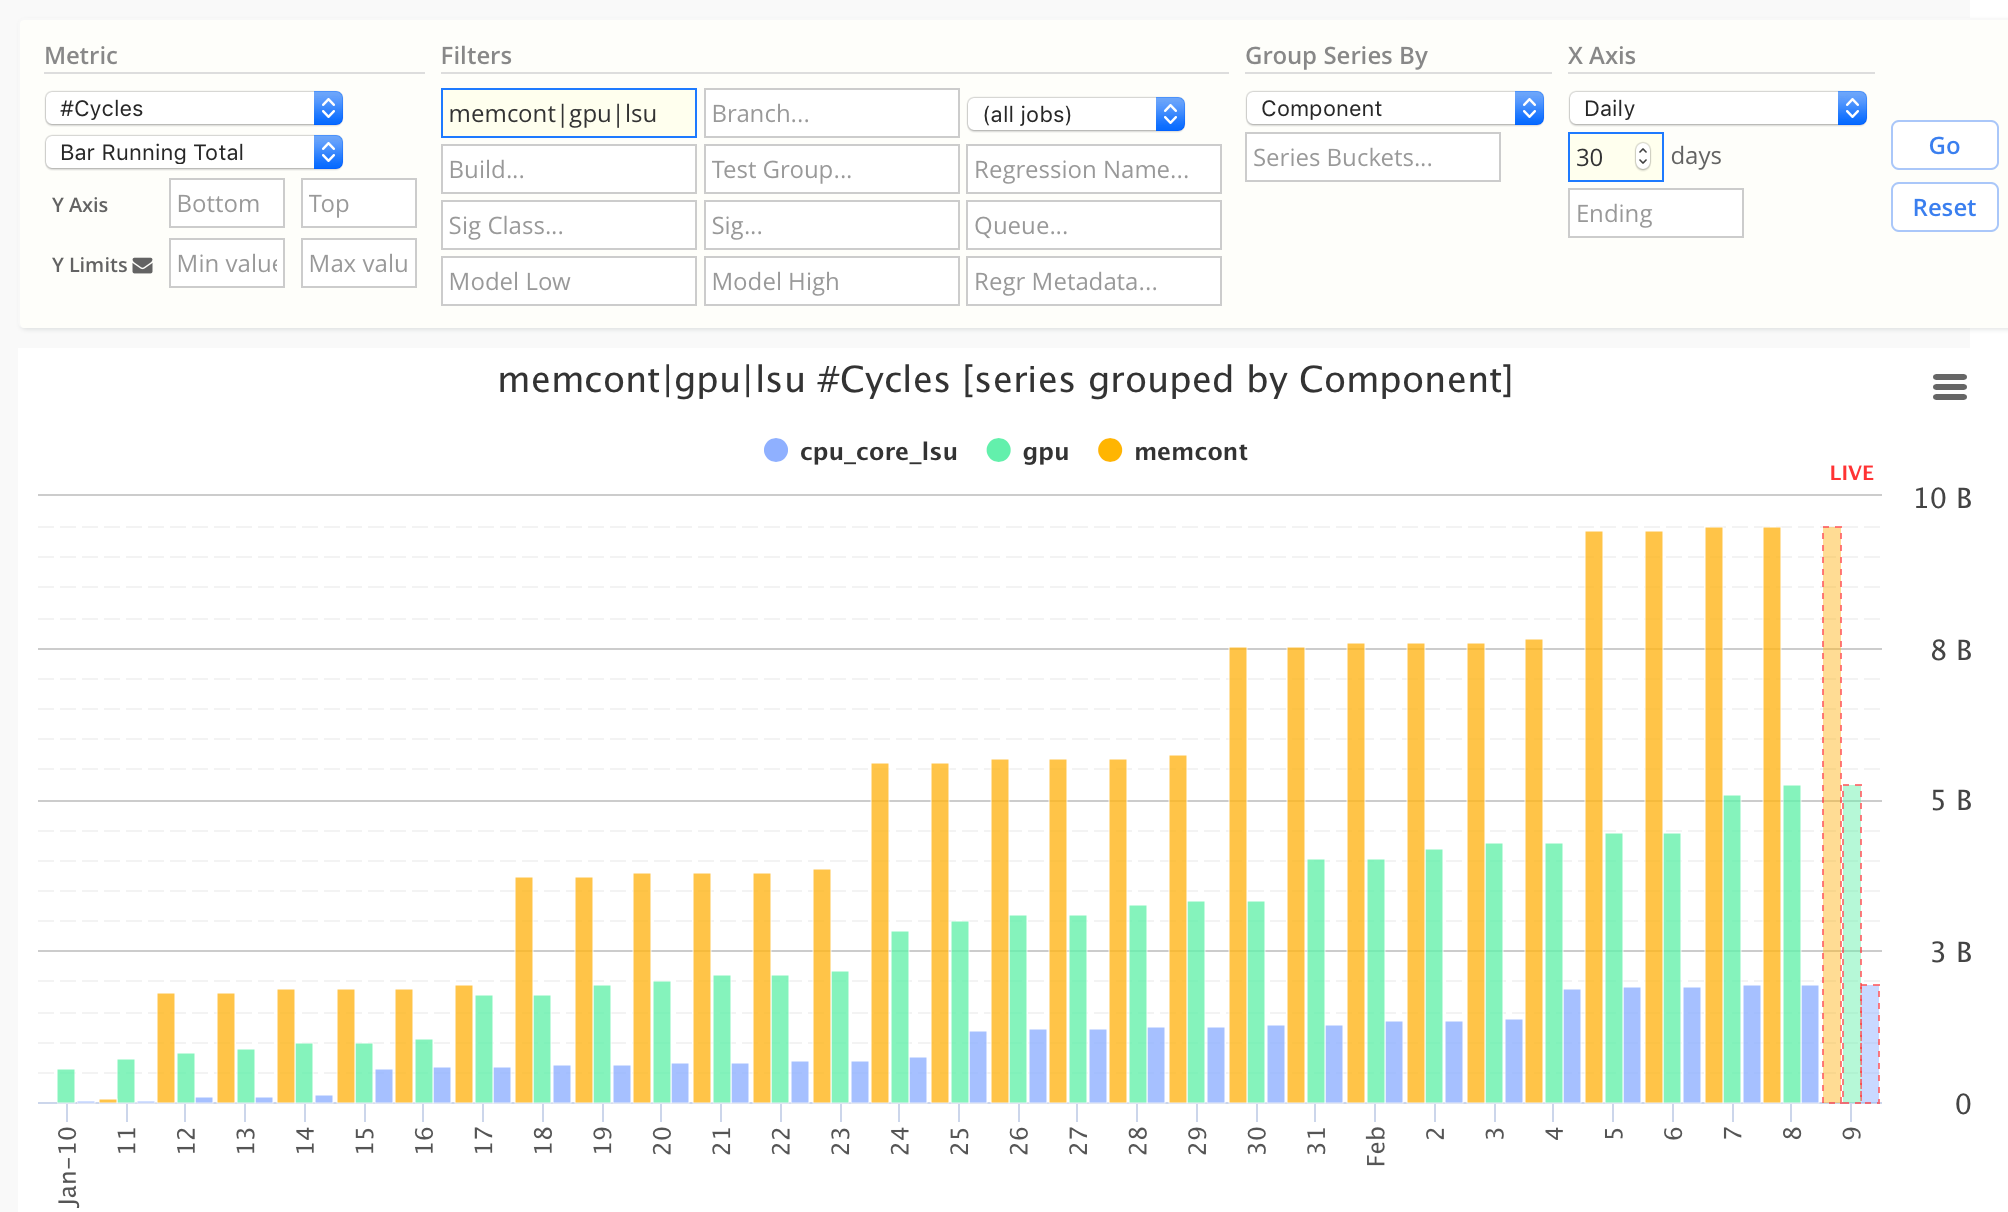
Bar Running Total
Bar Running Total is a cumulative chart, where each time segment value is the sum of all prior time segment values.
This is useful for generating running-total charts, like "Cumulative Cycles by Day".