Triage Charts
Simscope can chart Assignment, Triage, and Bug rates (useful in line and heatmap/datatable charts).
- These charts are similar to the Triage Report.
Triage terminology:
| Term | Description |
|---|---|
| Assigned | Signature has an Assignee. |
| Triaged | Signature has an Issue marked, or is Resolved, or is Ignored. |
| Resolved | Signature is either Fixed or Wontfix. |
For clarity, to calculate the equation Percentage Triaged:
Triaged   = (OPEN + FIXED + WONTFIX + IGNORE)
Total     = (NEW + ASSIGNED + OPEN + FIXED + WONTFIX + IGNORE)

% Triaged = (Triaged / Total)
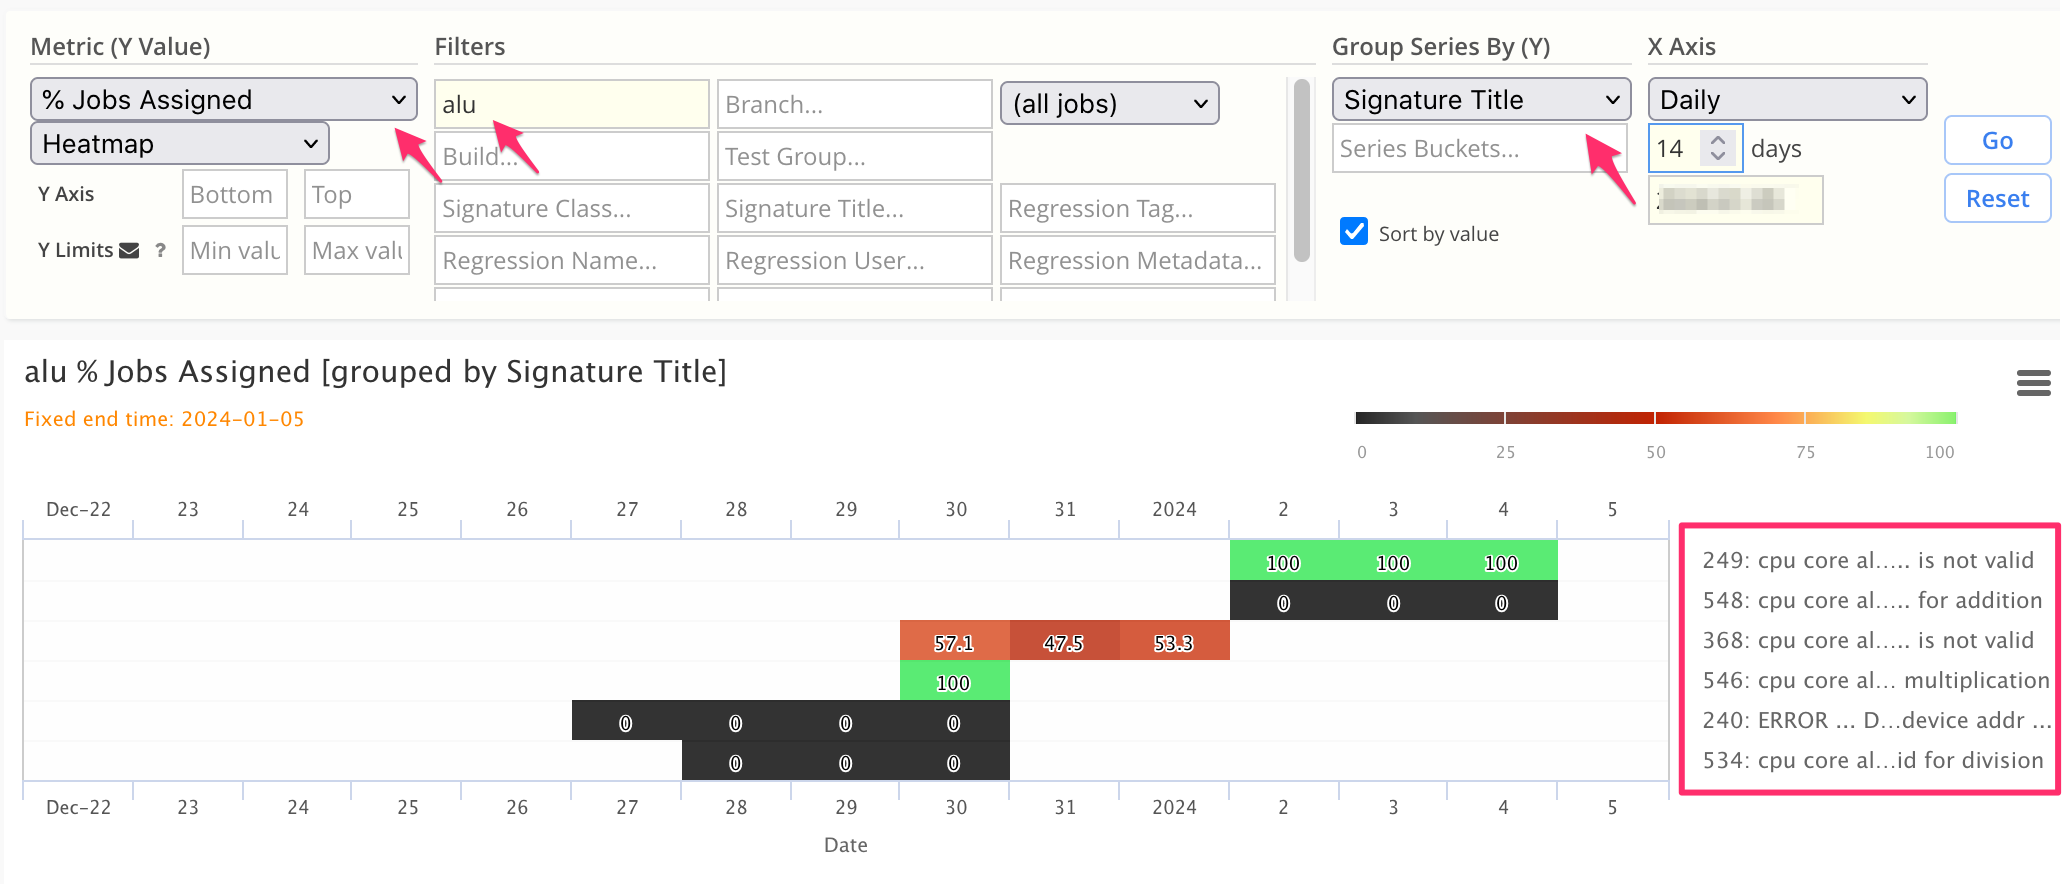
Percentage of Jobs Assigned, per Signature
This chart shows the percentage of jobs assigned for each Signature, within a single Component.
Chart Configuration:
| Chart Field | Value |
|---|---|
| Metric | % Jobs Assigned |
| Chart Type | Heatmap |
| Component | regex |
| X Axis | Daily |
| Group Series By | Signature Title |
Percentage of Jobs Assigned, per Regression
This chart shows the percentage of jobs assigned for each Regression (across all Components).
Chart Configuration:
| Chart Field | Value |
|---|---|
| Metric | % Jobs Assigned |
| Chart Type | Heatmap |
| X Axis | Daily |
| Group Series By | Regression Name |
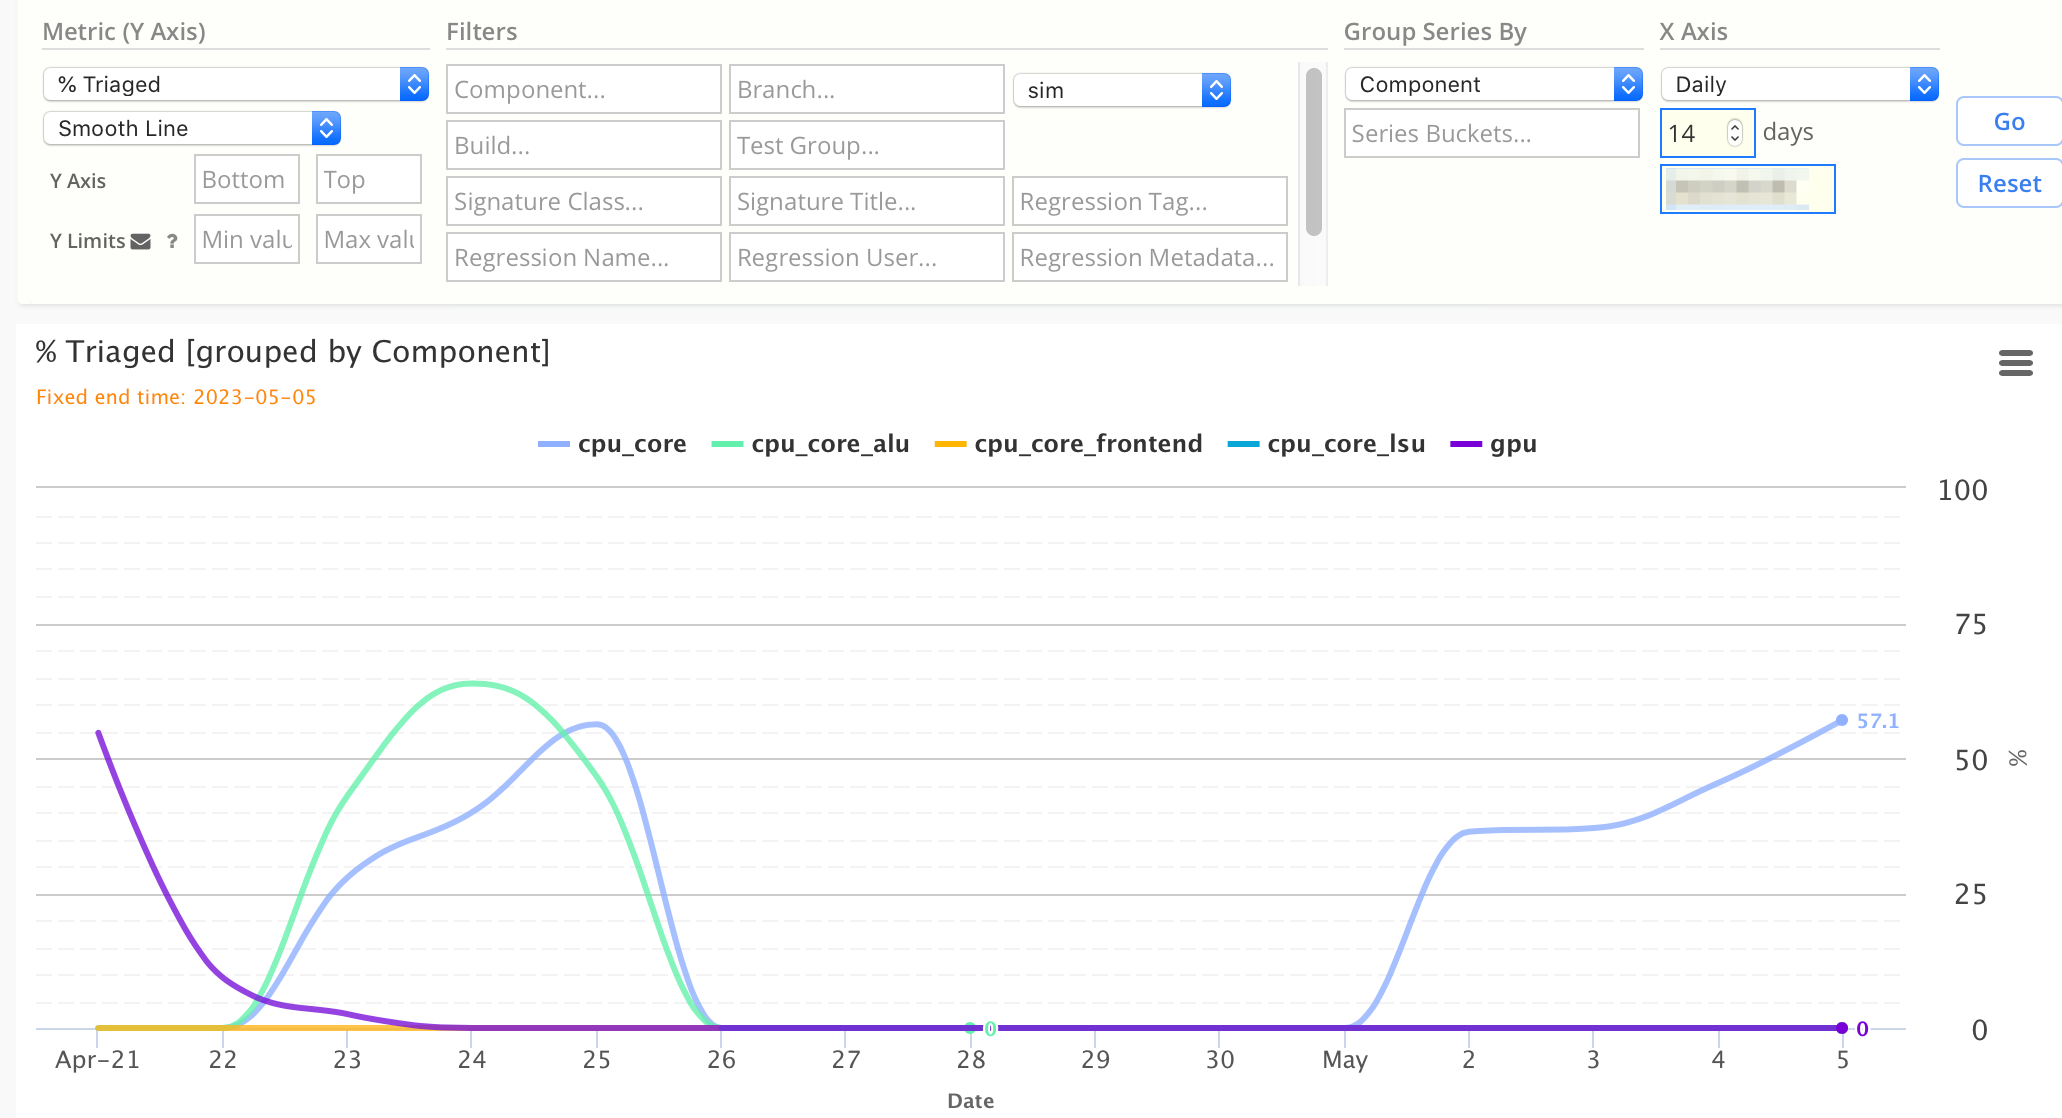
Percentage of Jobs Triaged
This chart shows a 14 day line chart of the percentage of daily errors being triaged, grouped by Component.
Chart Configuration:
| Chart Field | Value |
|---|---|
| Metric | % Jobs Triaged |
| Chart Type | Line |
| X Axis | Daily |
| Group Series By | Component |
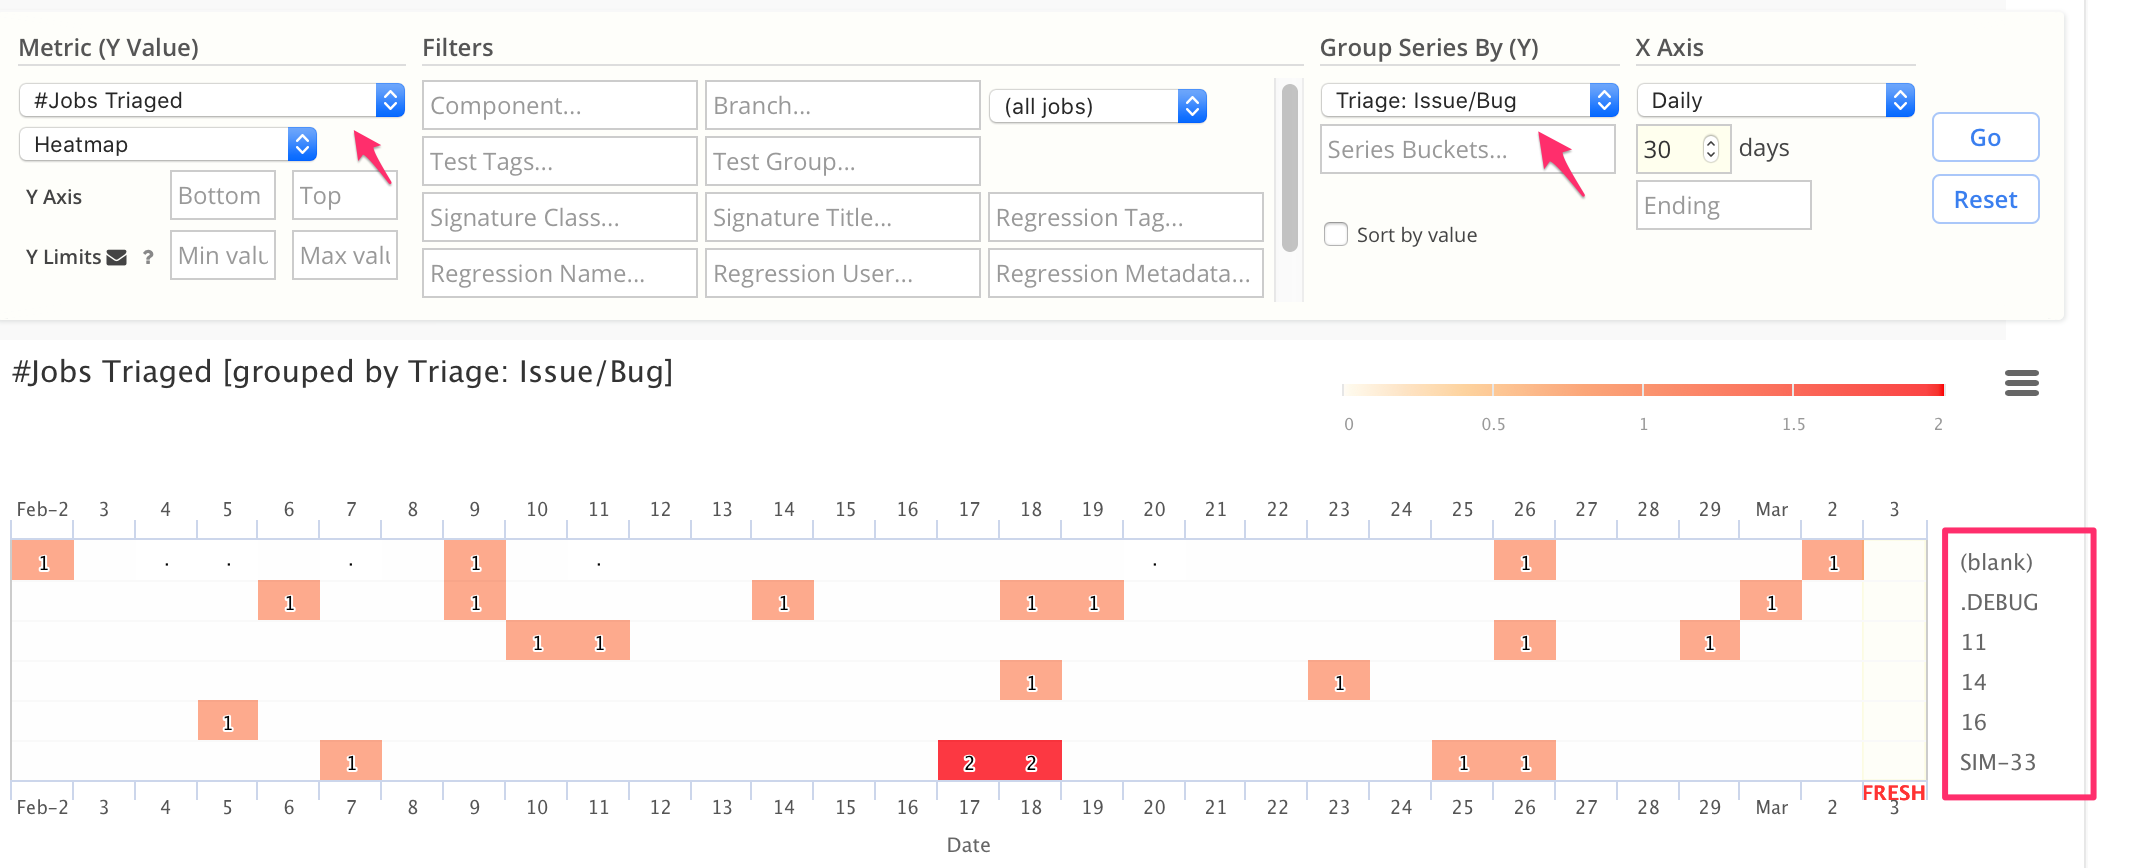
Number of Jobs Triaged, per Bug
This chart shows a 30-day heatmap of the number of jobs linked to each bug.
- (blank) issue indicates a Signature assignment with empty bug.
Chart Configuration:
| Chart Field | Value |
|---|---|
| Metric | # Jobs Triaged |
| Chart Type | Heatmap |
| X Axis | Daily |
| Group Series By | Triage: Issue/Bug |
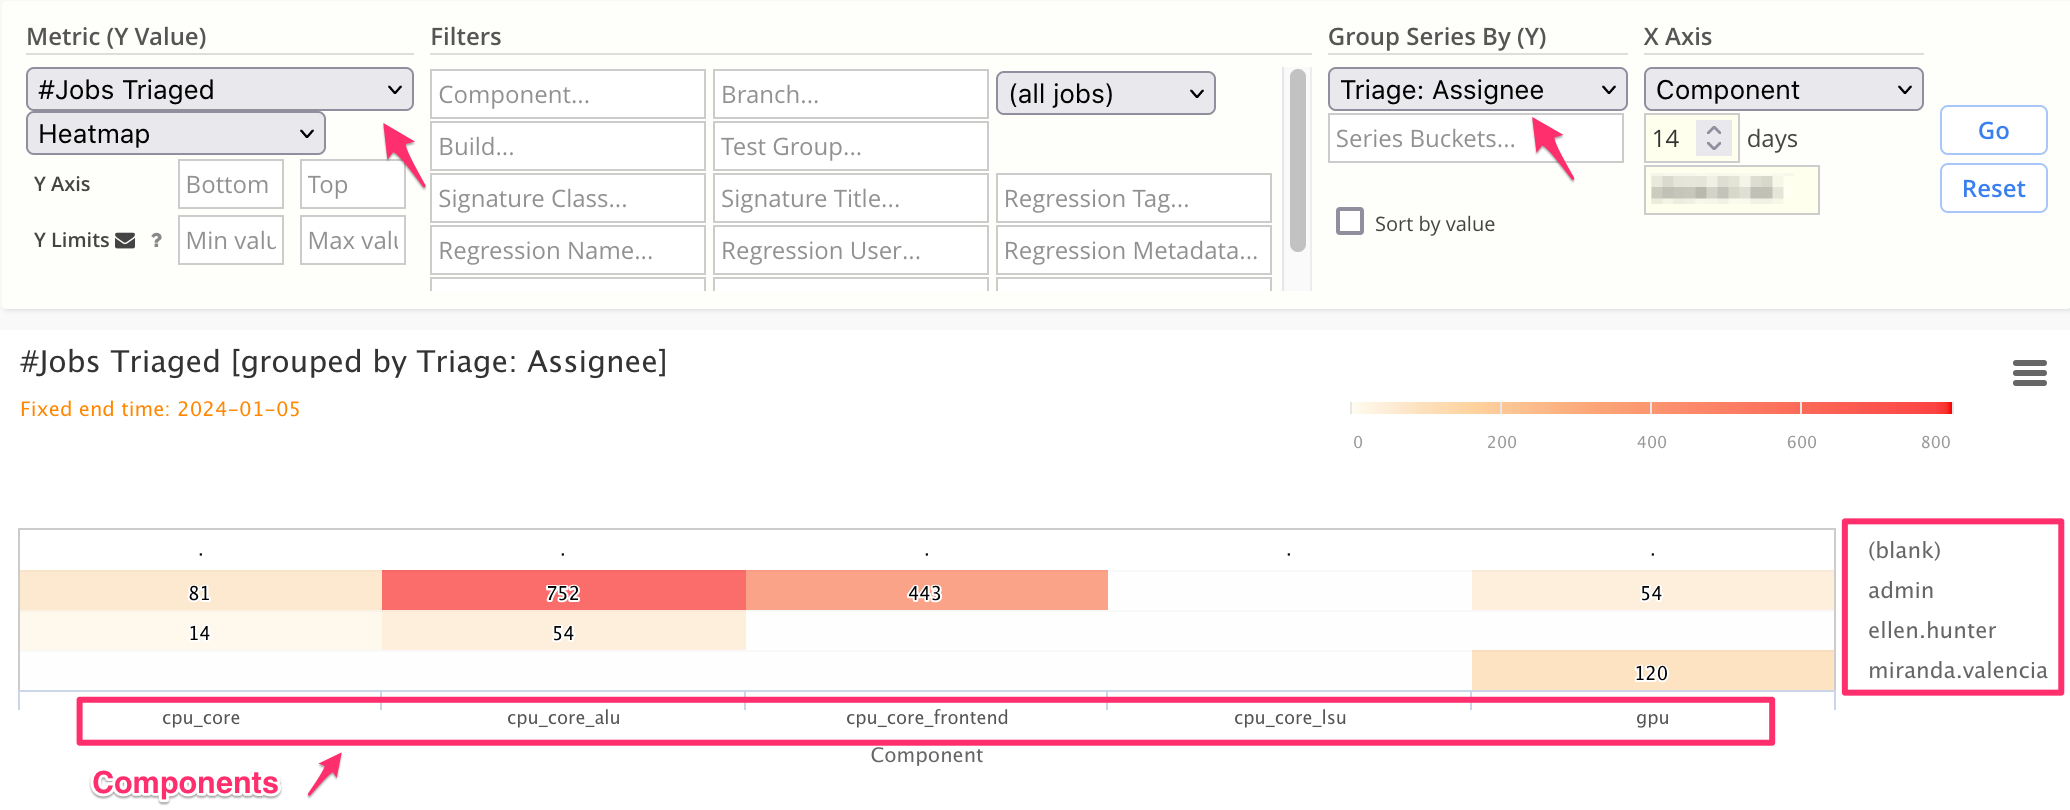
Number of Jobs Triaged, per User
This chart shows a 14-day summary heatmap of the number of jobs assigned to each user, summarized for each Component.
- Note that each vertical column in the heatmap represents the assignments for each Component.
Chart Configuration:
| Chart Field | Value |
|---|---|
| Metric | # Jobs Triaged |
| Chart Type | Heatmap |
| X Axis | Component |
| Group Series By | Triage: Assignee |
Admin: Enabling Triage Charts
Note: if you don't see these triage chart choices in Simscope, please have your Simscope Administrator enable this feature.
To enable:
- Edit your simscope.config file and add
sigtriageindex:
[tests]
# Enable signature triage index (enables build/testgroup search from signatures, and triage charts)
sigtriageindex = true
- Restart Simscope.
- Click the Admin Lock in the top-right corner.
- Click Table Reindex (bottom of the page).
- Click Signature Triage Index checkbox.
- Click Reindex button.
You can monitor the Simscope terminal log for progress.
- This may take a half-day, depending on your database size.
- Note: it is okay to import regressions while this is running in the background.


