Charts by Example
Here are a variety of basic charts you can generate with Simscope Metric Charts, showing both an example chart and the configuration used to render it.
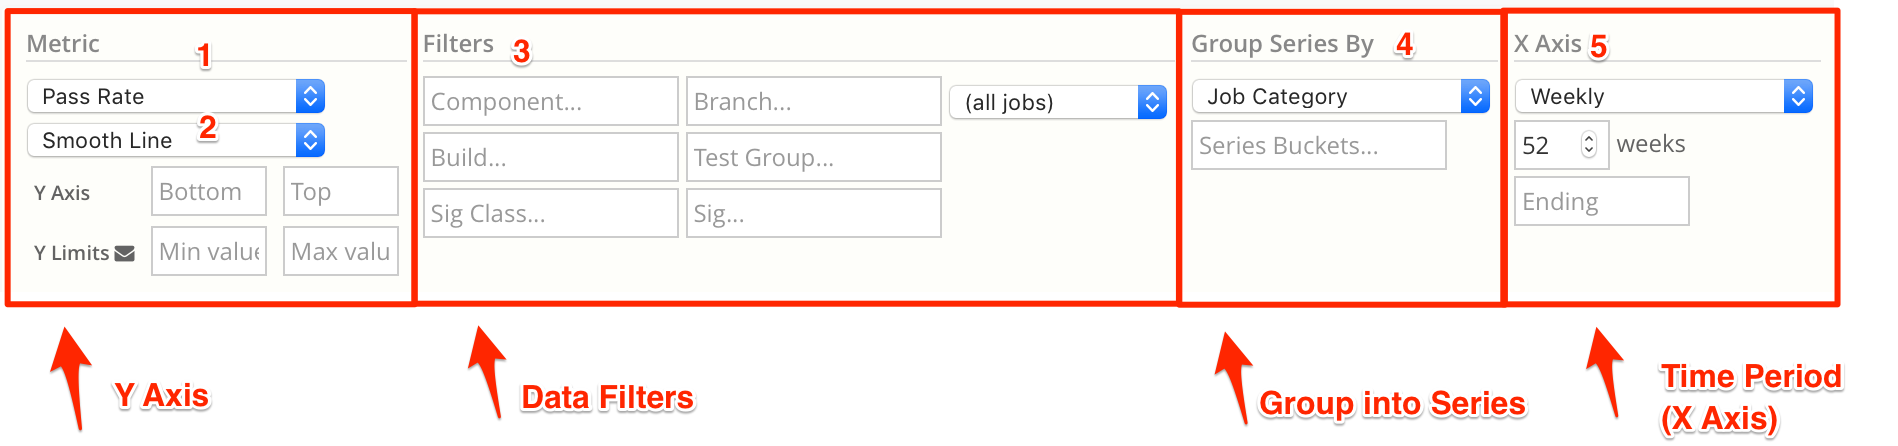
Chart Configuration overview
Weekly Pass Rate, by Job Category
Note: this is the simplest chart configuration, to see how charts work.
This is a 52-week Line Chart of average Pass Rate among all jobs, grouped by Job Category:
compile— bluegen(ie generate) — greensim(ie simulate) — orange
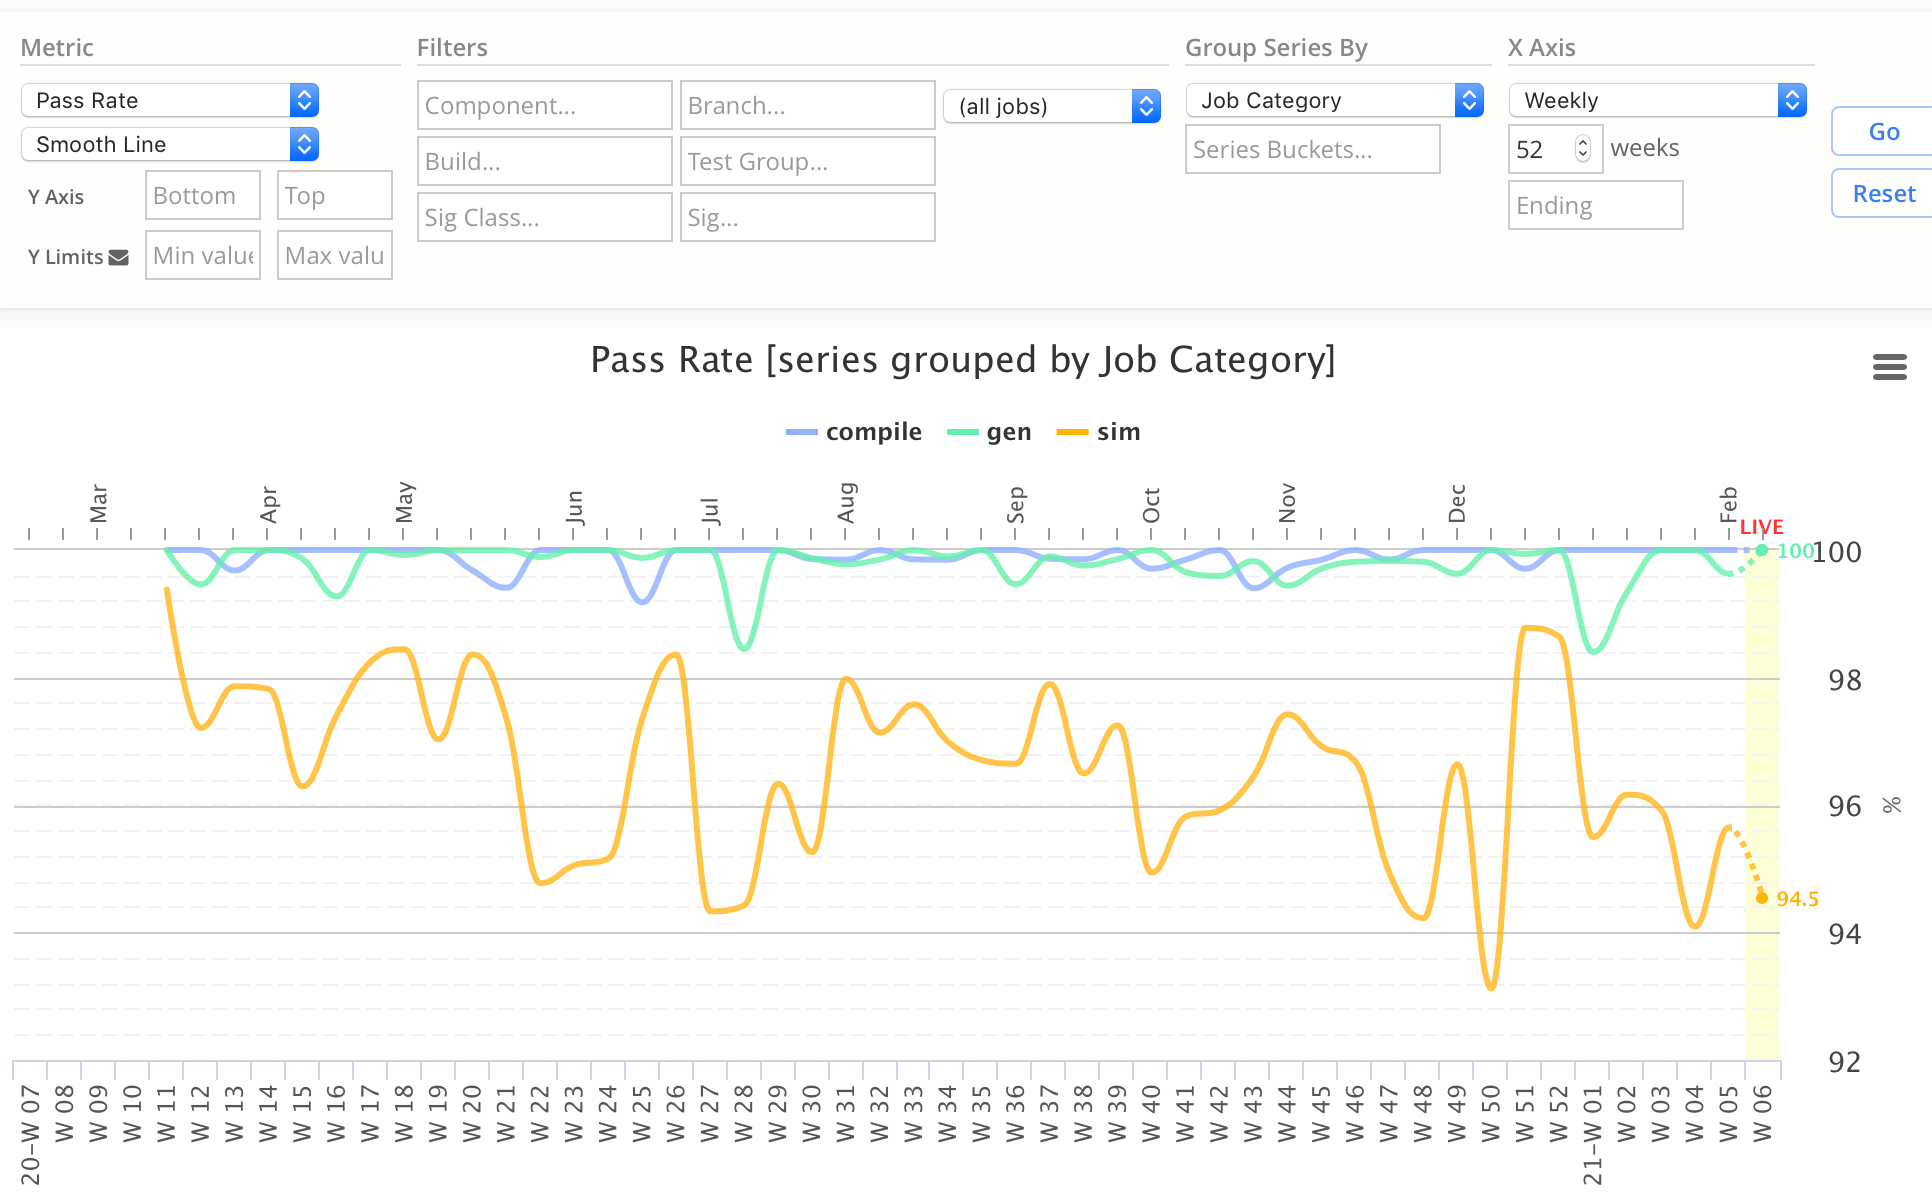
Chart Configuration:
| Chart Field | Value |
|---|---|
| Metric | Pass Rate |
| Chart Type | Line |
| X Axis | Weekly |
| Group Series By | Job Category |
Daily Pass Rate, by Component
This is a 30-day line chart showing average Pass Rate for 3 components:
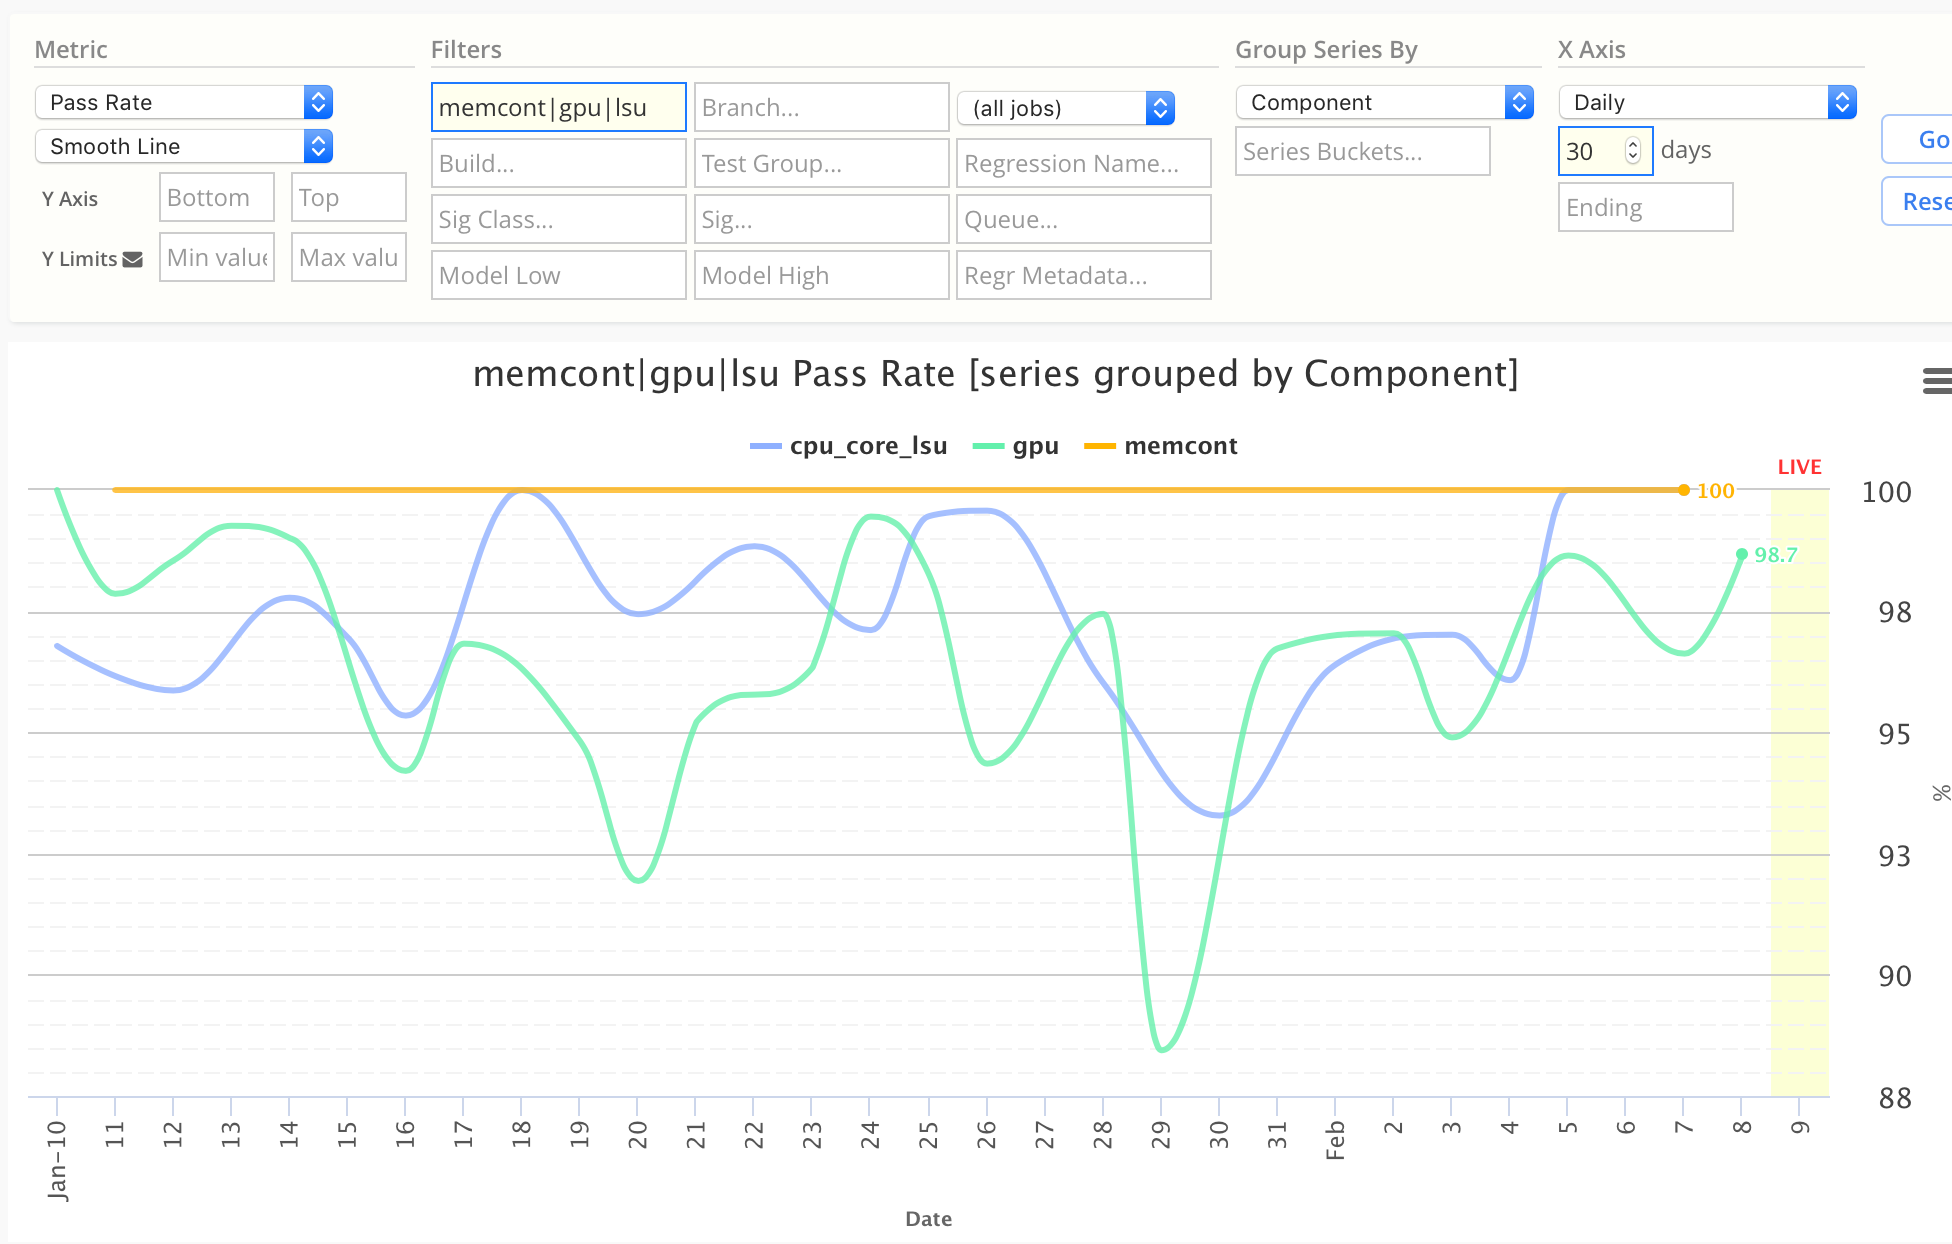
Chart Configuration:
| Chart Field | Value |
|---|---|
| Metric | Pass Rate |
| Chart Type | Line |
| X Axis | Daily |
| Group Series By | Component |
| Compute | (enter a regex) |
Weekly Cycles, by Component
This uses a Stacked Bar chart, which enables seeing total weekly cycles as well as individual component weekly cycles.
- Each component's cycles are a different color
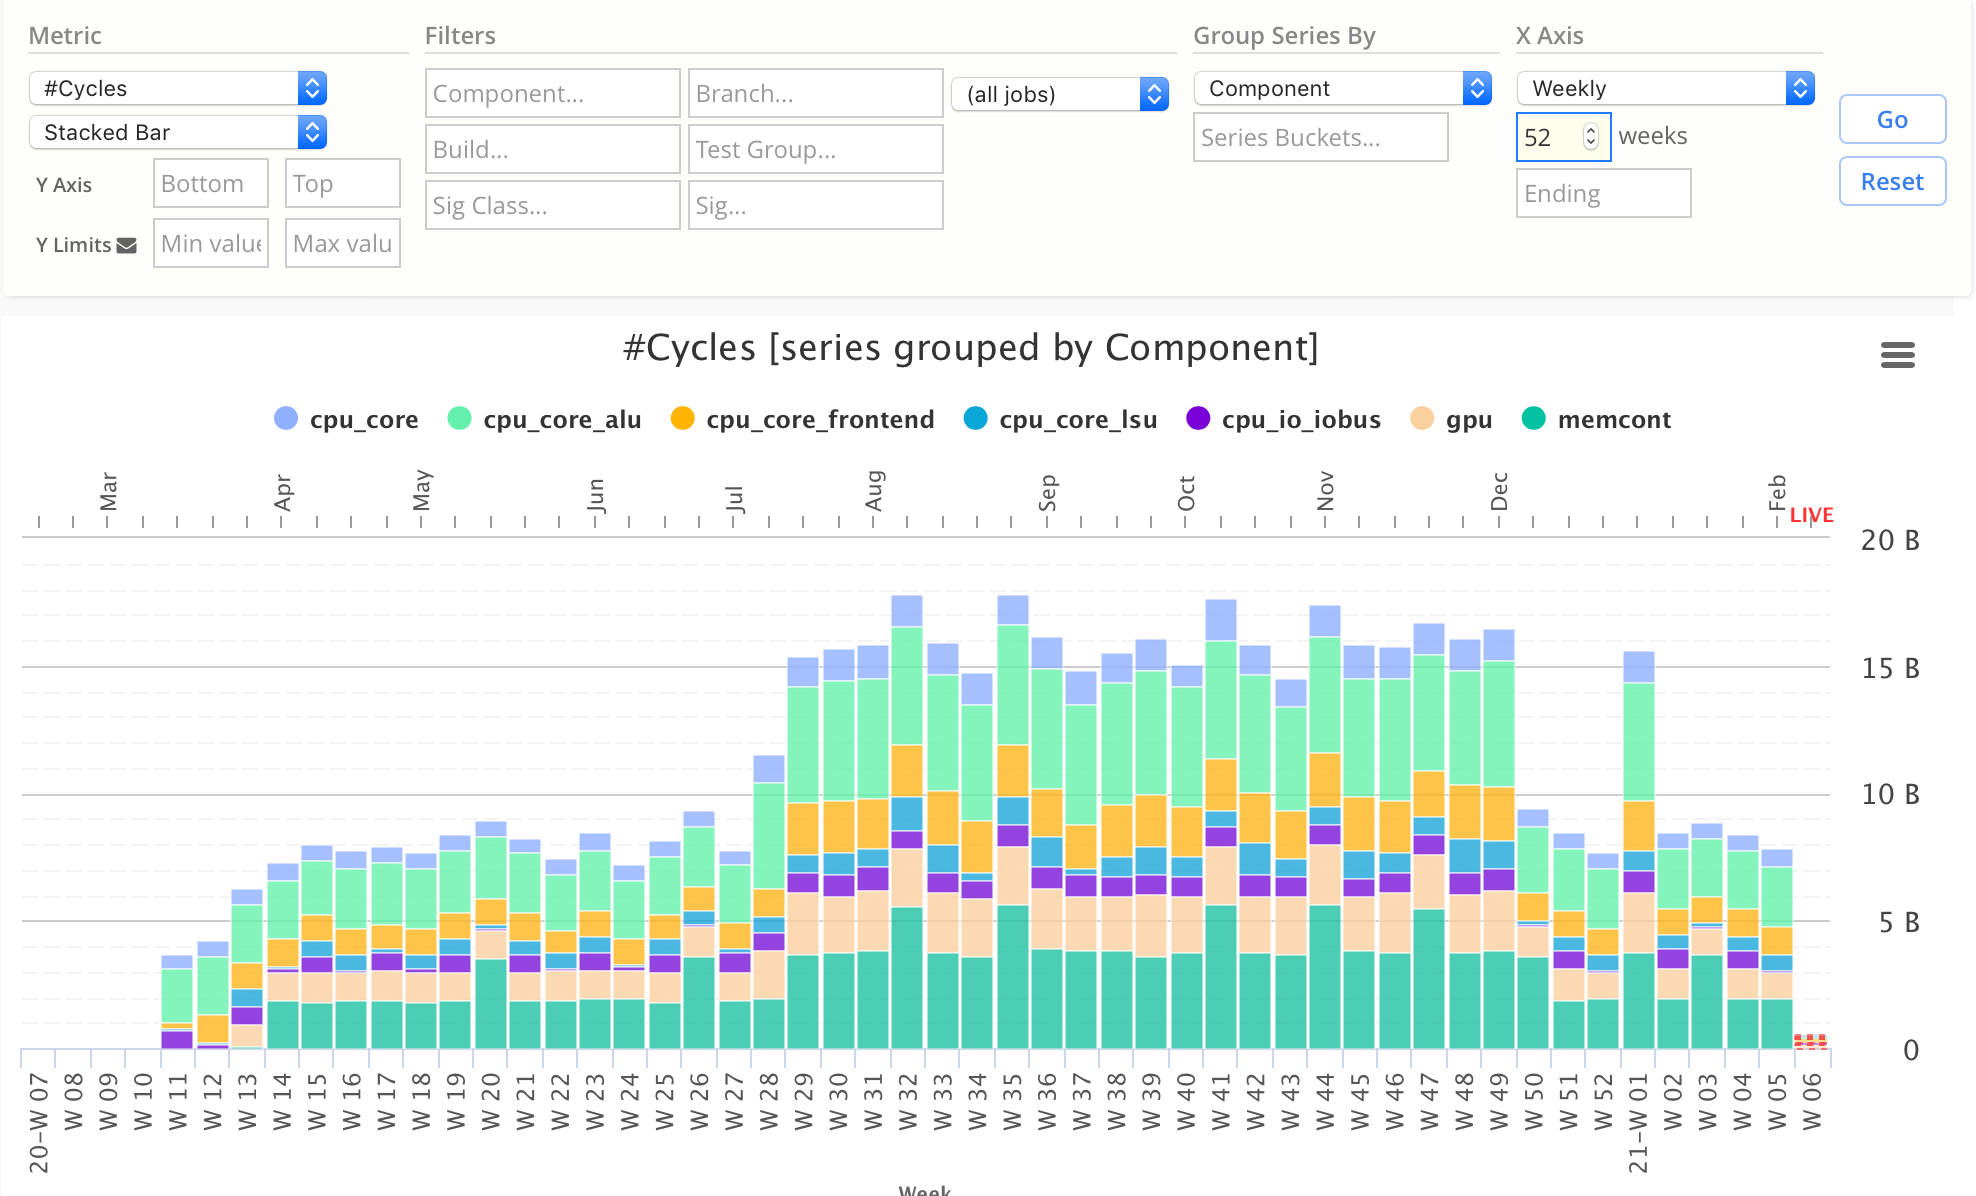
Chart Configuration:
| Chart Field | Value |
|---|---|
| Metric | Cycles |
| Chart Type | Stacked Bar |
| X Axis | Weekly |
| Group Series By | Component |
Weekly Compute Time Percentage, by Component
This uses a Percent Area chart, which enables seeing visually which components are using the highest and lowest percentage of total compute time, across each week.
- Percent Area charts scale the Y values to 100%, so you can view percentages easily.
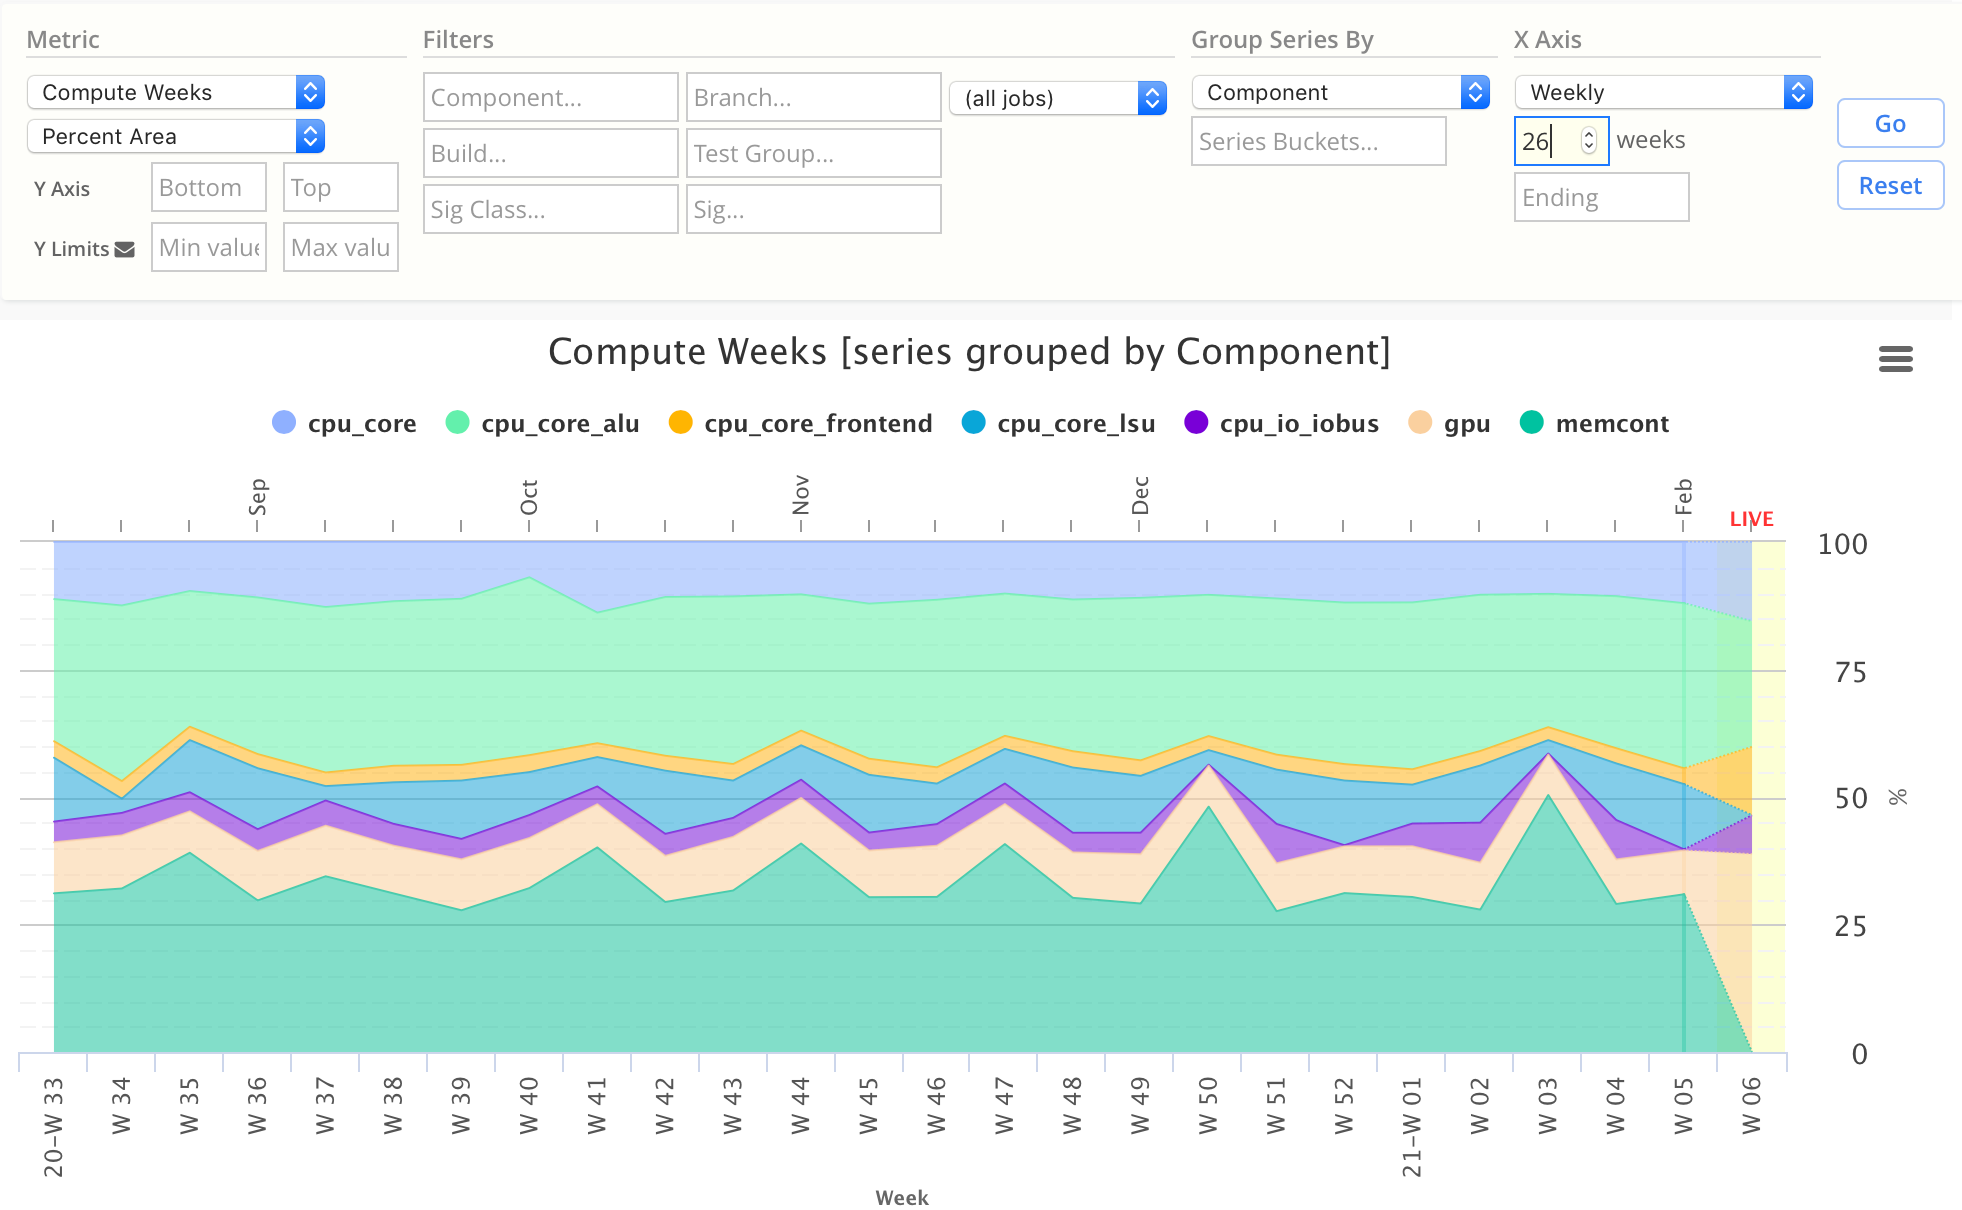
Chart Configuration:
| Chart Field | Value |
|---|---|
| Metric | Compute Weeks |
| Chart Type | Percent Area |
| X Axis | Weekly |
| Group Series By | Component |
CPS (cycles per second), by Regression
This is a Line Chart showing CPS for a group of regressions.
- You can click on any point in the line, to drilldown to regression details at that point.
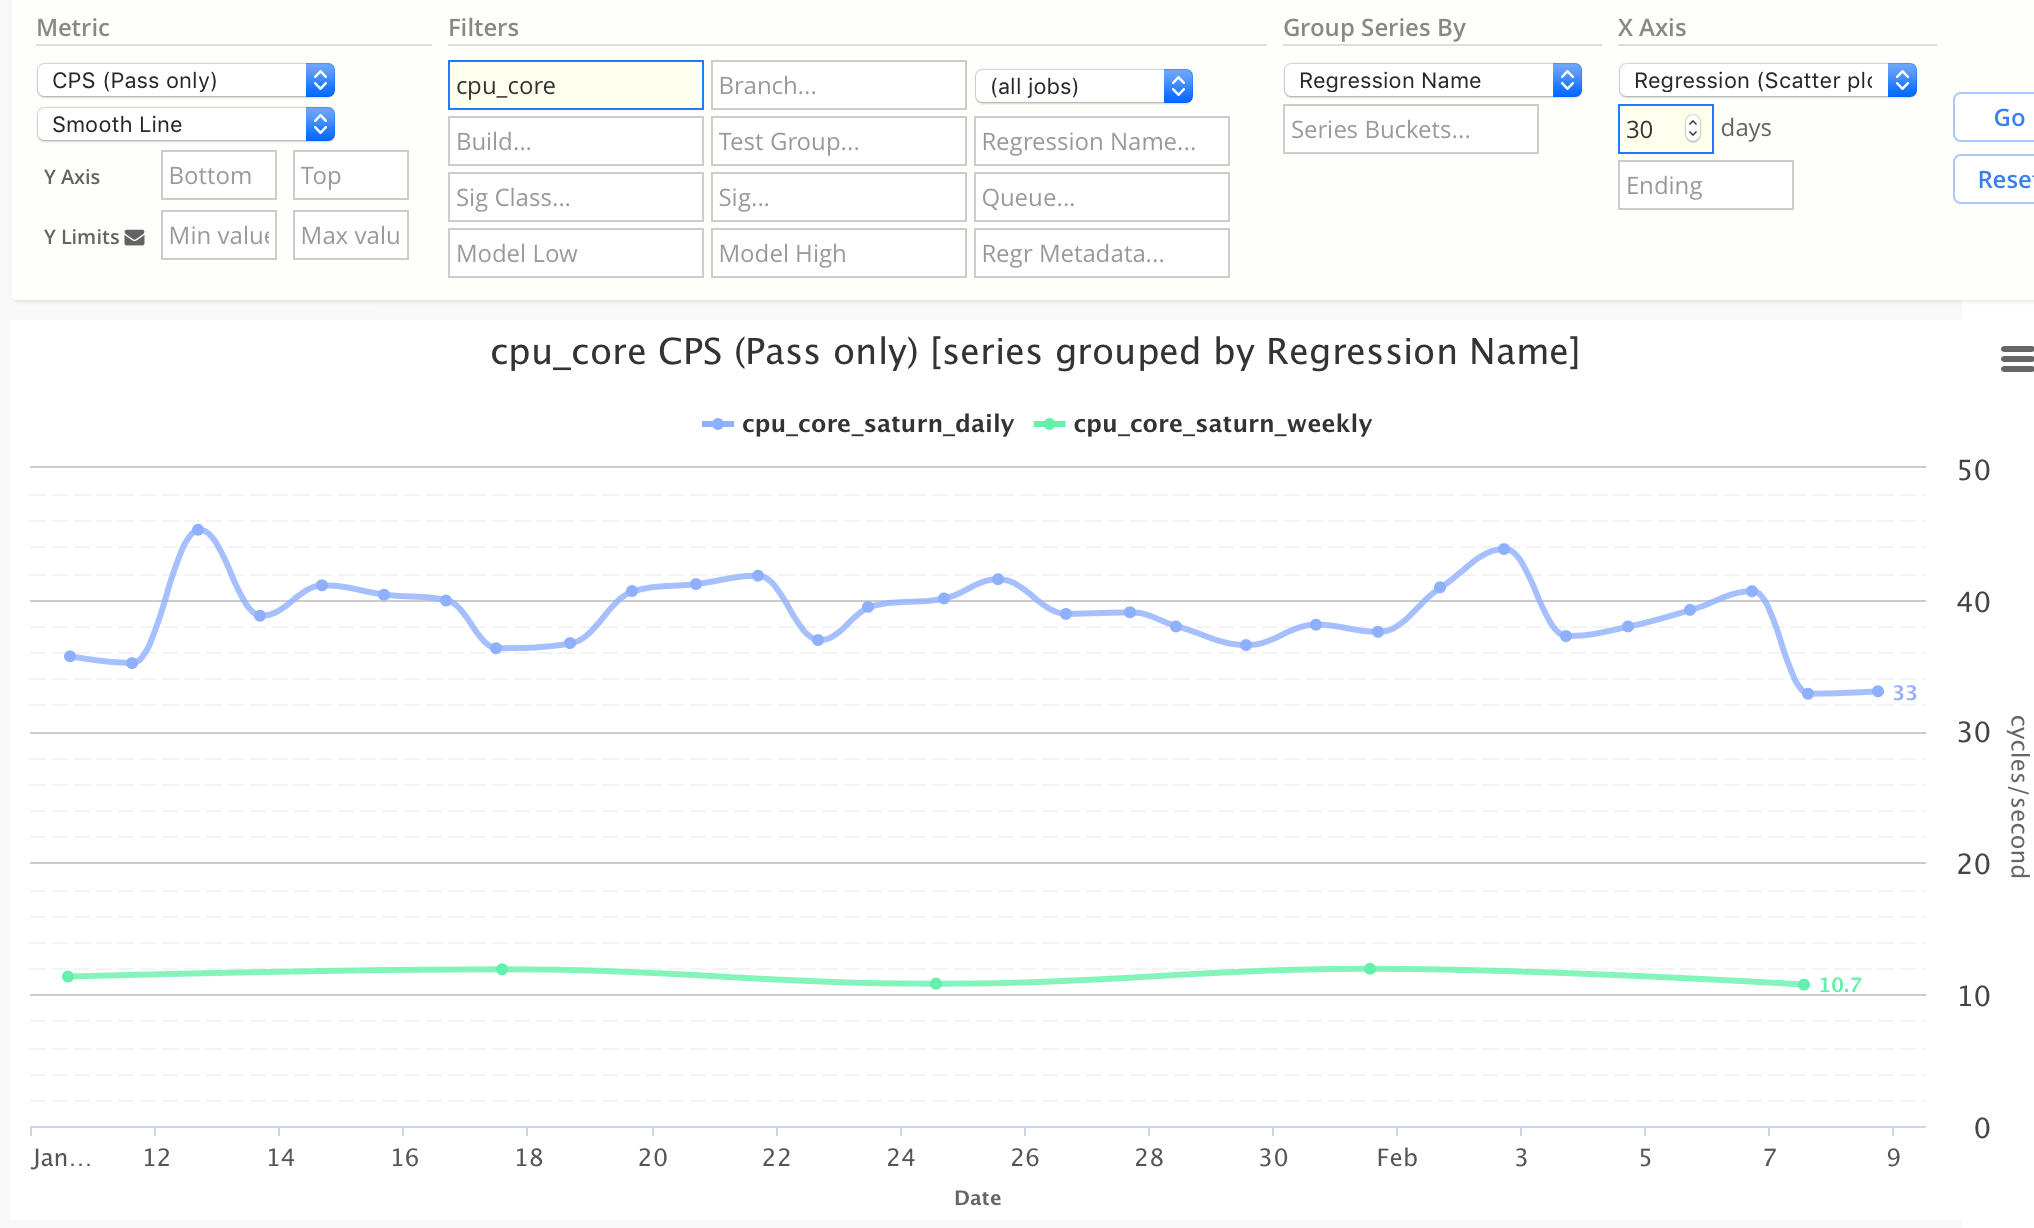
Chart Configuration:
| Chart Field | Value |
|---|---|
| Metric | CPS (Pass Only) |
| Chart Type | Line |
| X Axis | Regression (Scatter) |
| Group Series By | Regression Name |
| Component | (enter regex) |
Regression CPS (cycles per second), by Build
Within a series of Regressions, you can group by their build configuration.
For example, this charts CPS grouped by:
- 1-core (blue)
- 2-core (green)
- 4-core (orange)
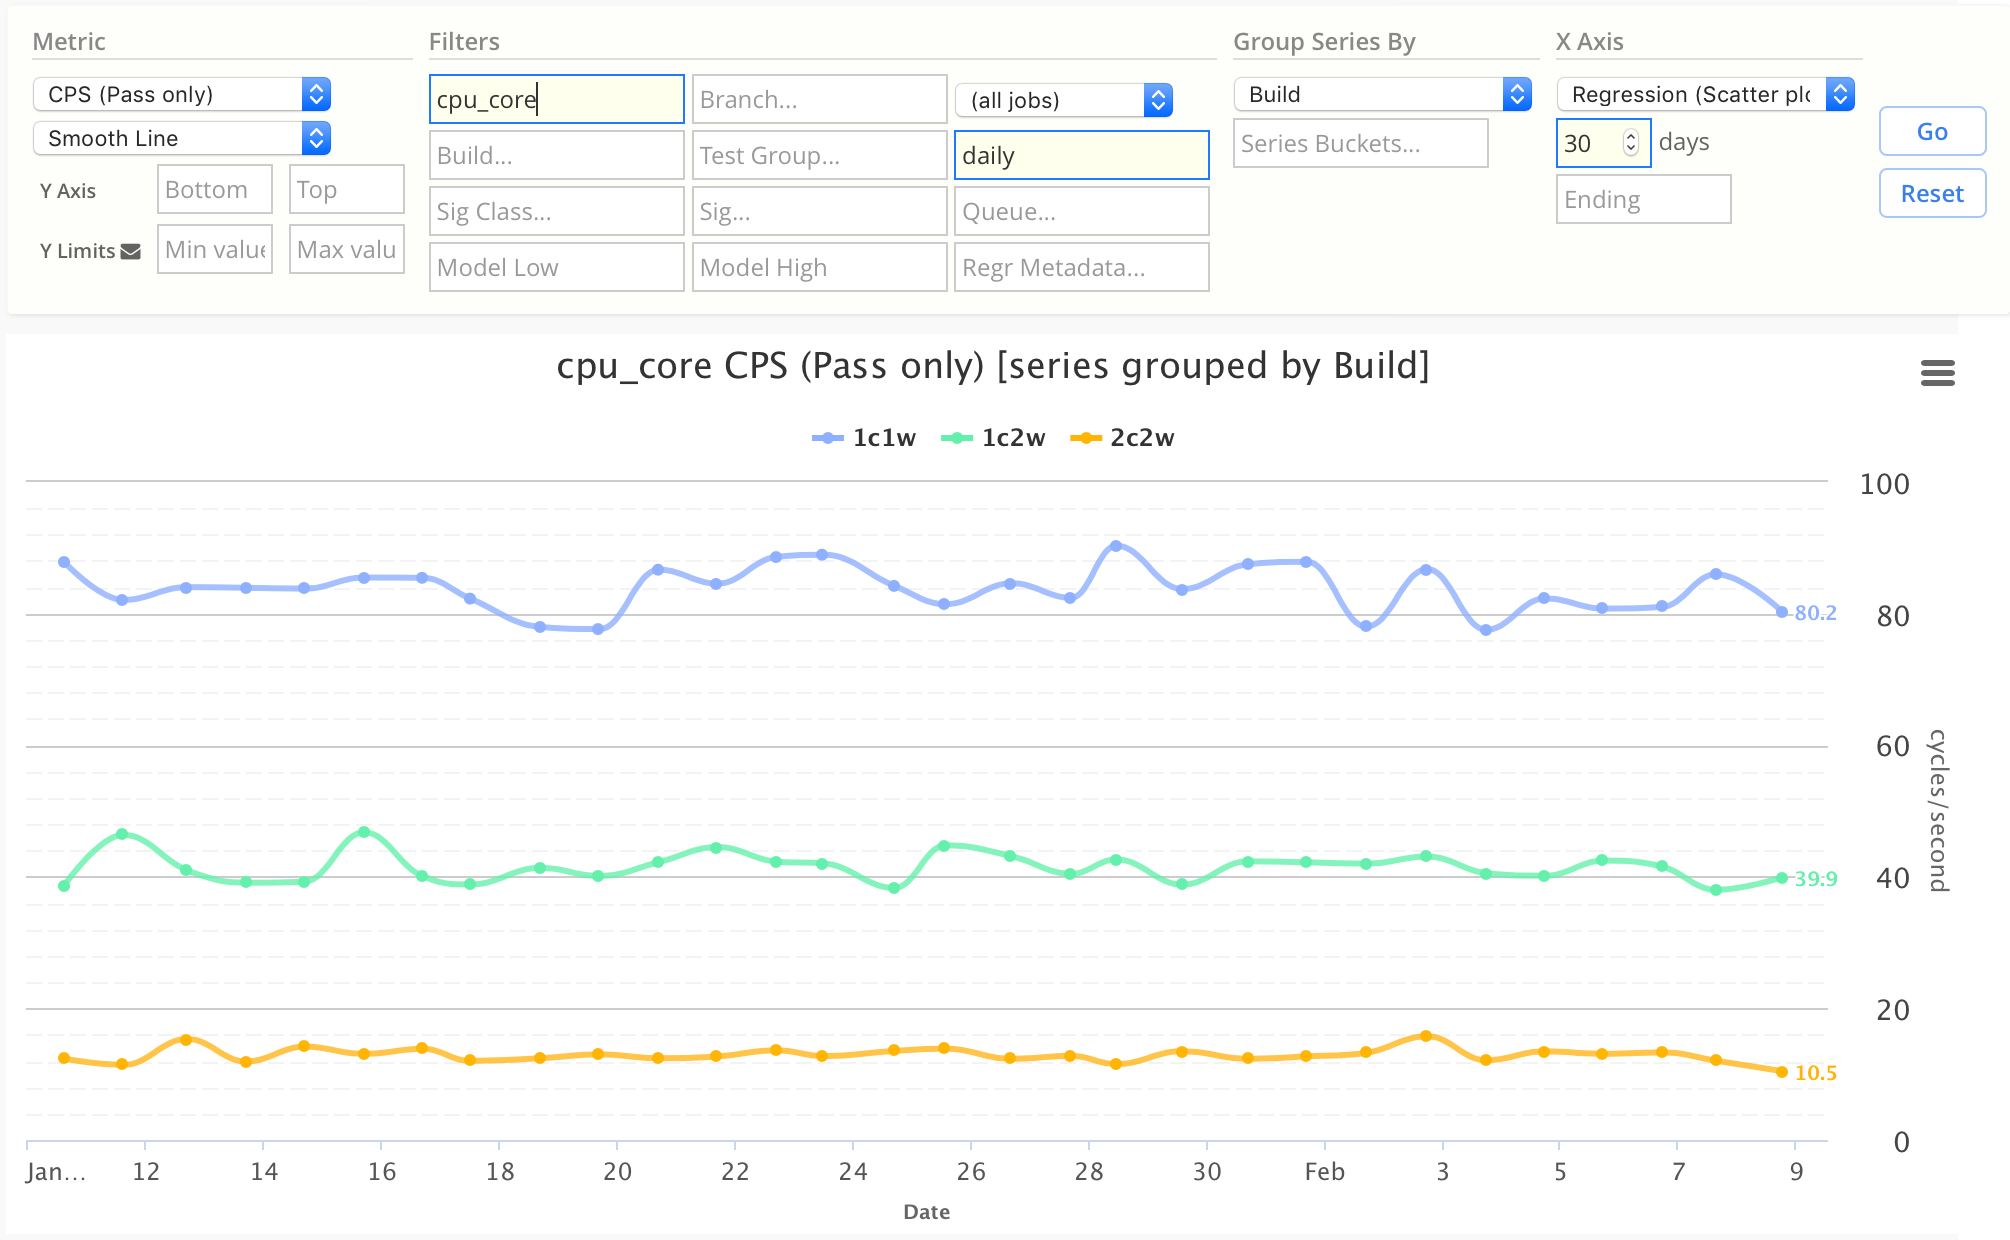
Chart Configuration:
| Chart Field | Value |
|---|---|
| Metric | CPS (Pass Only) |
| Chart Type | Line |
| X Axis | Regression (Scatter) |
| Group Series By | Build |
| Component | (enter a regex) |
| Regression Name | (enter a regex) |
Running Total Weekly Cycles, by Component
This uses an Area Running Total chart, which enables seeing cumulative weekly cycles across each component for the past 52 weeks (year).
This is also called a summation chart, or a cumulative chart.
- Each component's cycles are a different color
- You can also see the total cycles for the year, across all components, was 550 billion
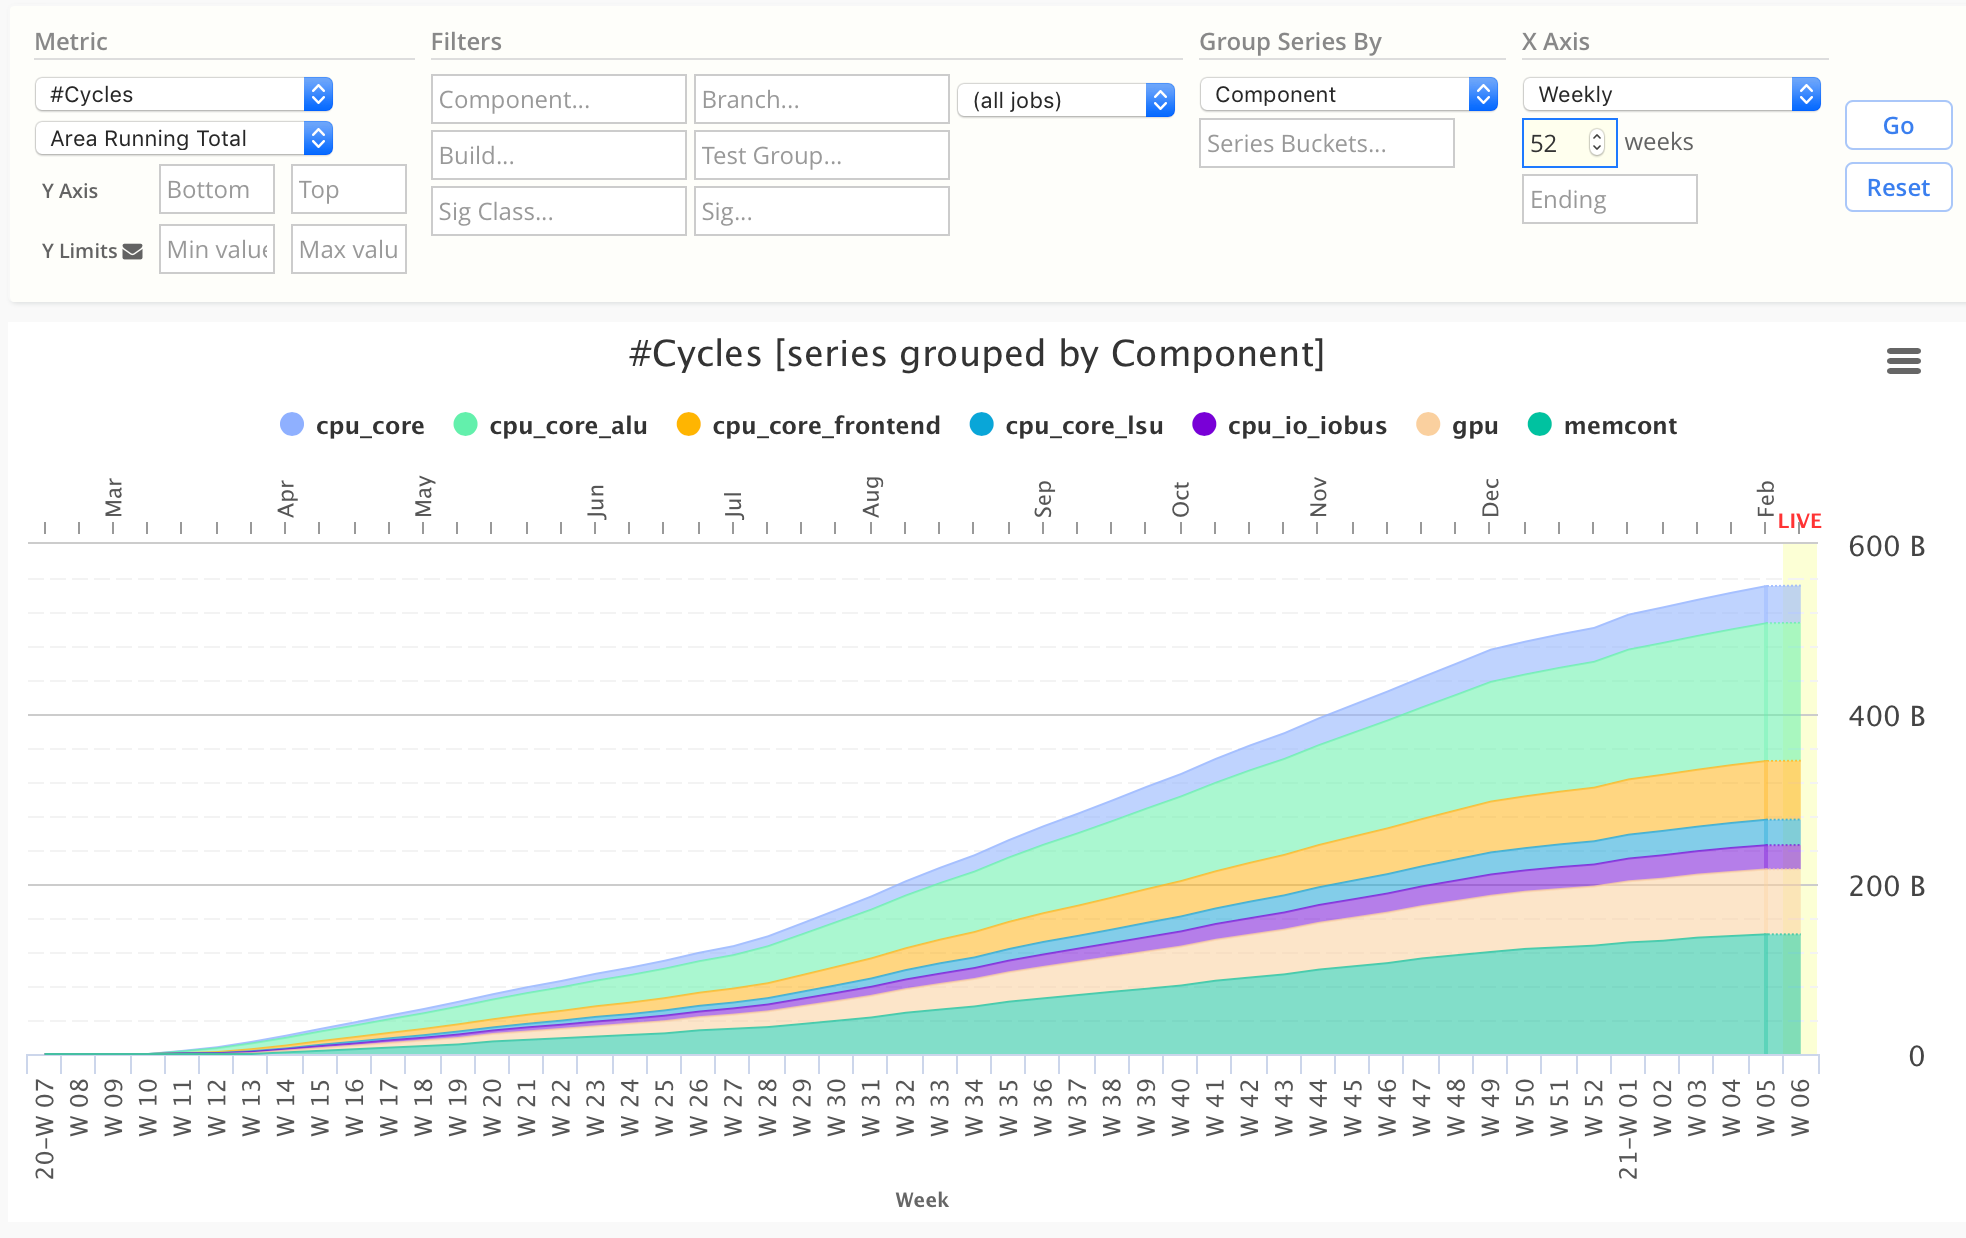
Chart Configuration:
| Chart Field | Value |
|---|---|
| Metric | Cycles |
| Chart Type | Stacked Bar |
| X Axis | Weekly |
| Group Series By | Component |
Pie chart, by Signature Classification
Pie charts are useful at showing ratios or comparisons of data.
This example shows the percentage of failures for the past 30 days, grouped by Signature Classification.
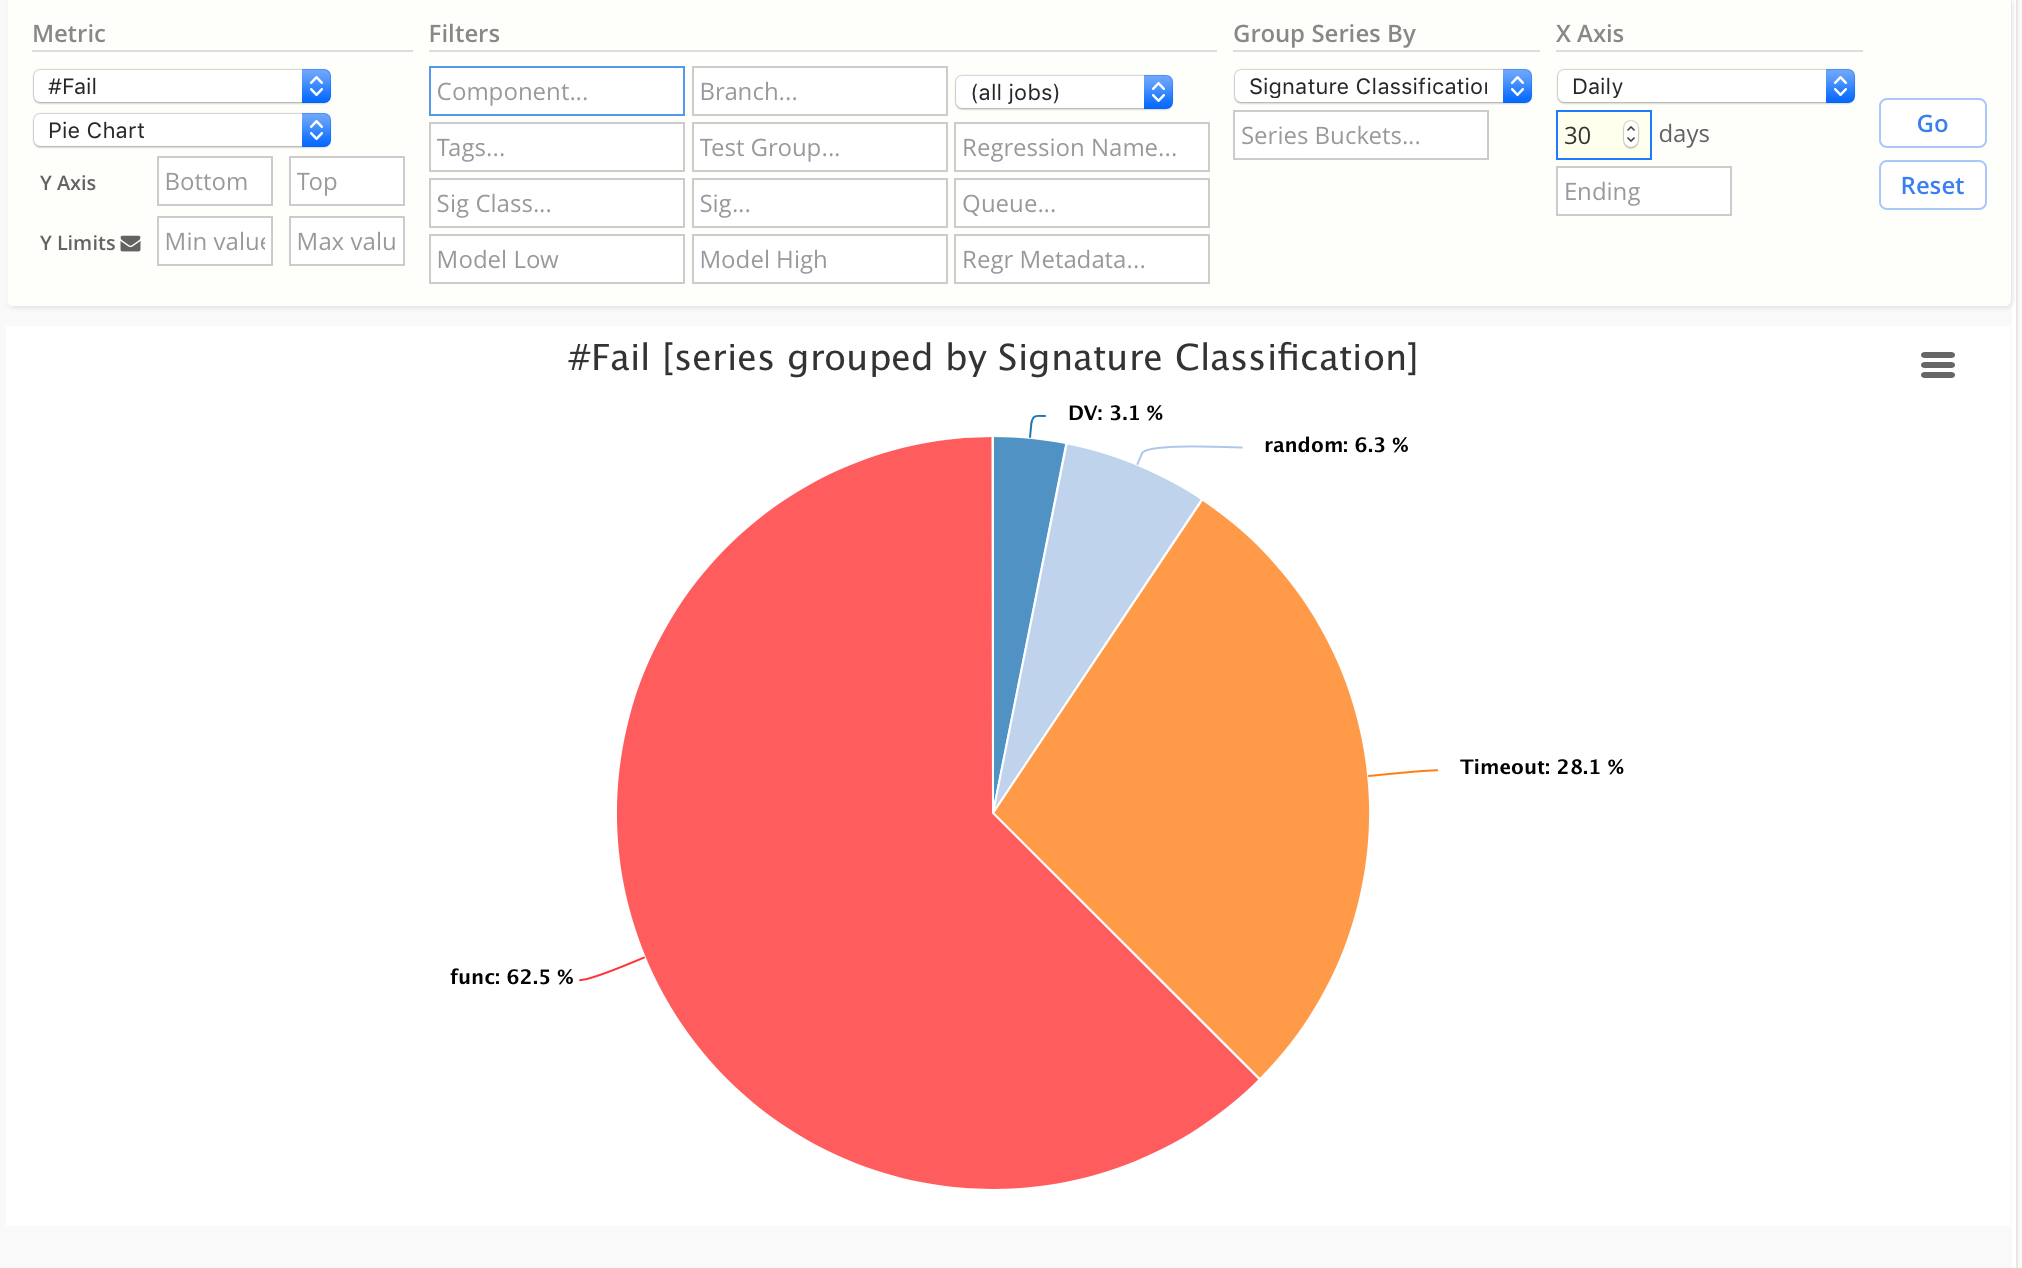
Chart Configuration:
| Chart Field | Value |
|---|---|
| Metric | #Fail |
| Chart Type | Pie |
| X Axis | Daily |
| Group Series By | Signature Classification |
Regression Coverage Chart (using metadata)
If you are storing coverage values inside of Regression Metadata, you can create coverage charts with Simscope.
This example plots the metadata func_coverage and line_coverage, for a 100-day period.
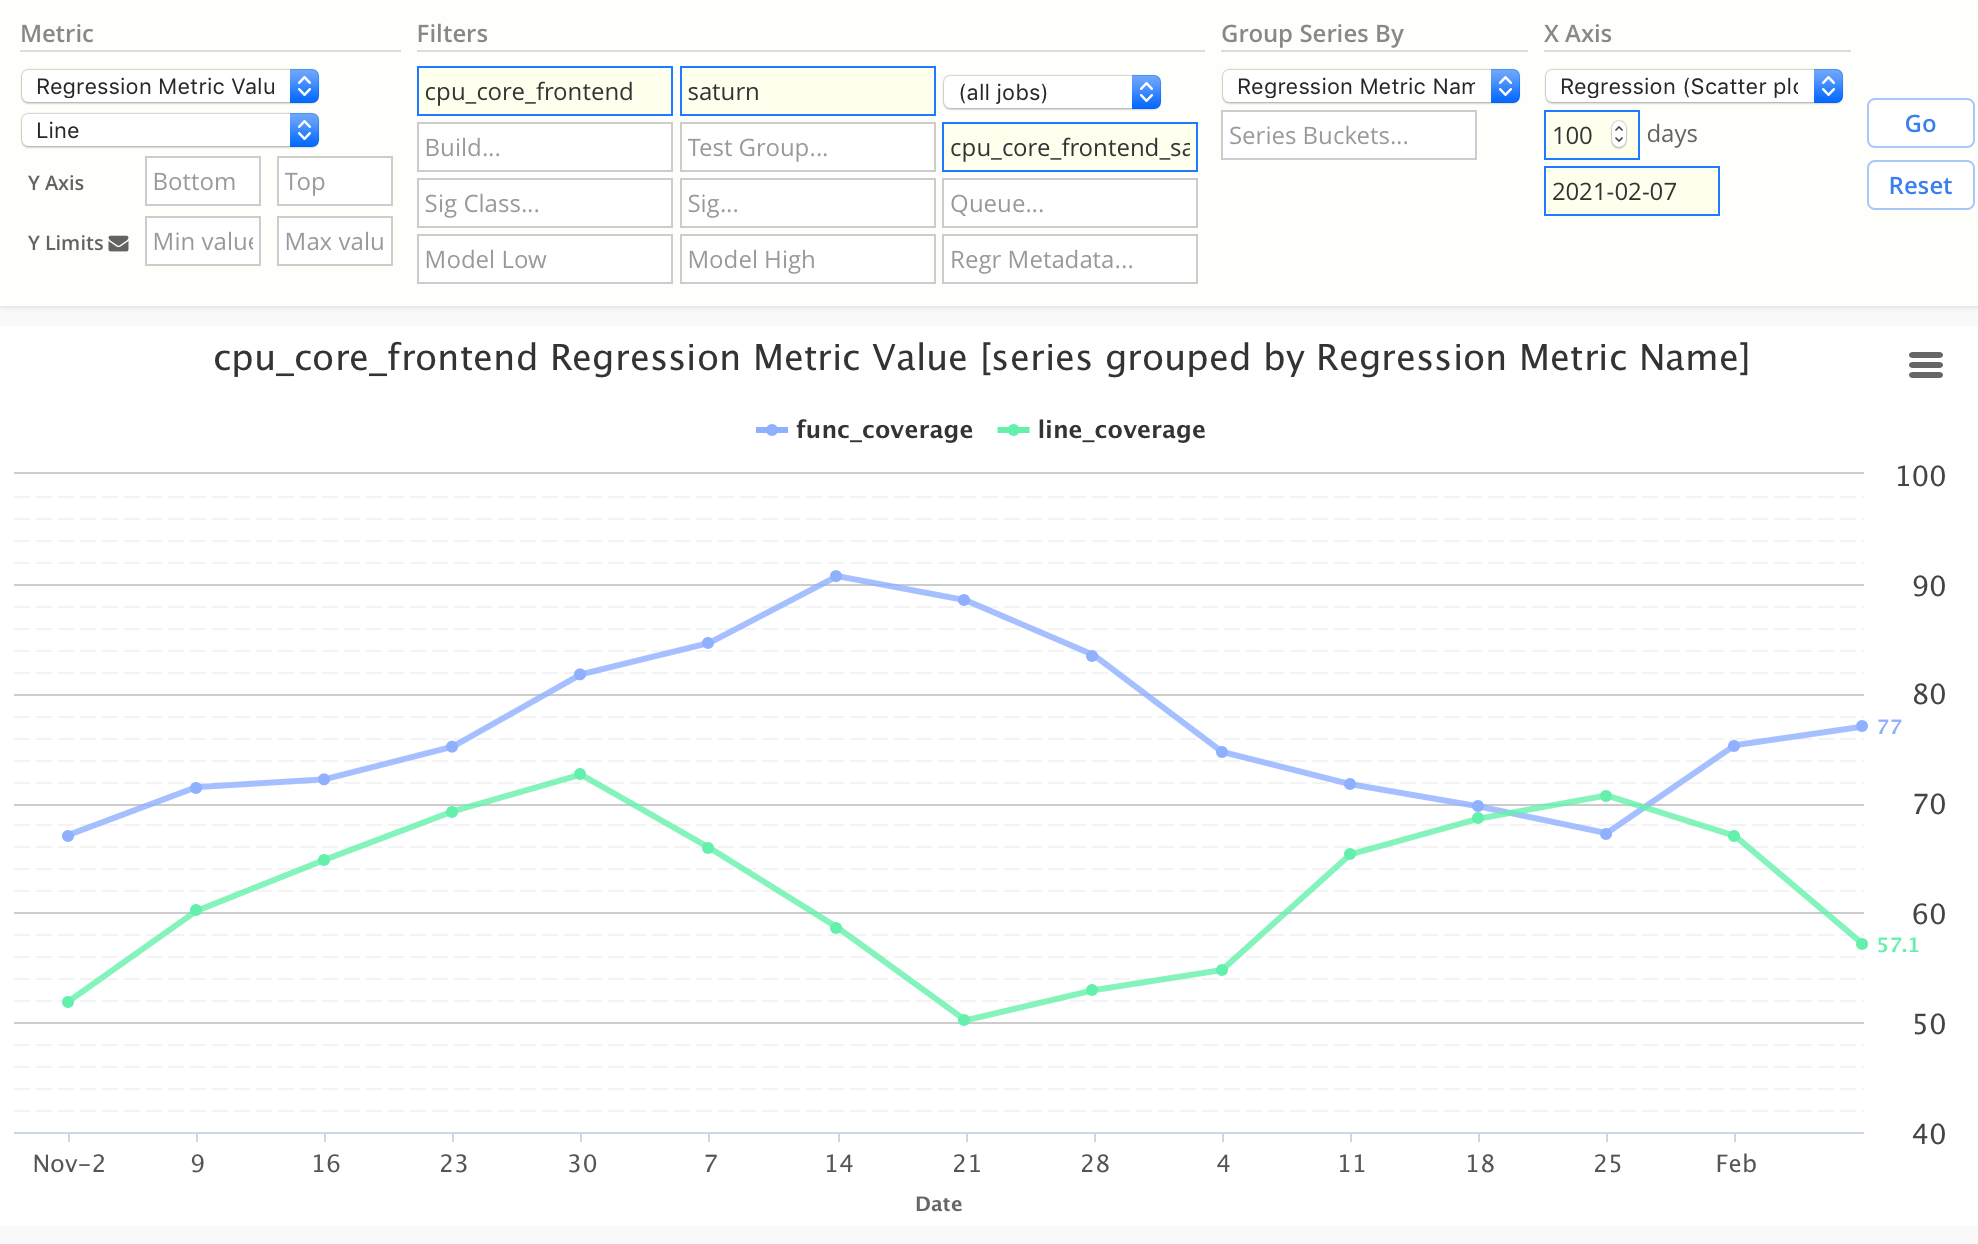
Chart Configuration:
| Chart Field | Value |
|---|---|
| Metric | Regression Metric Value |
| Chart Type | Line |
| X Axis | Regression (Scatter Plot) |
| Group Series By | Regression Metric Value |
| Component | (enter a regex) |
| Regression Name | (enter a regex) |
| Regr Metadata | (optional: enter a specific coverage series name) |
Daily Regression Pass Rate Heatmap
Heatmap Charts are useful when visualizing many series simultaneously.
- As opposed to line charts, which can become cluttered if there are more then 3 or 4 series in a single chart.
This is a 30-day Heatmap Chart of Pass Rate, grouped by regression name.
- Note that when charting Pass Rate, the Heatmap chart will colorize the values (ie green, yellow, red) to make it easy to see patterns visually.
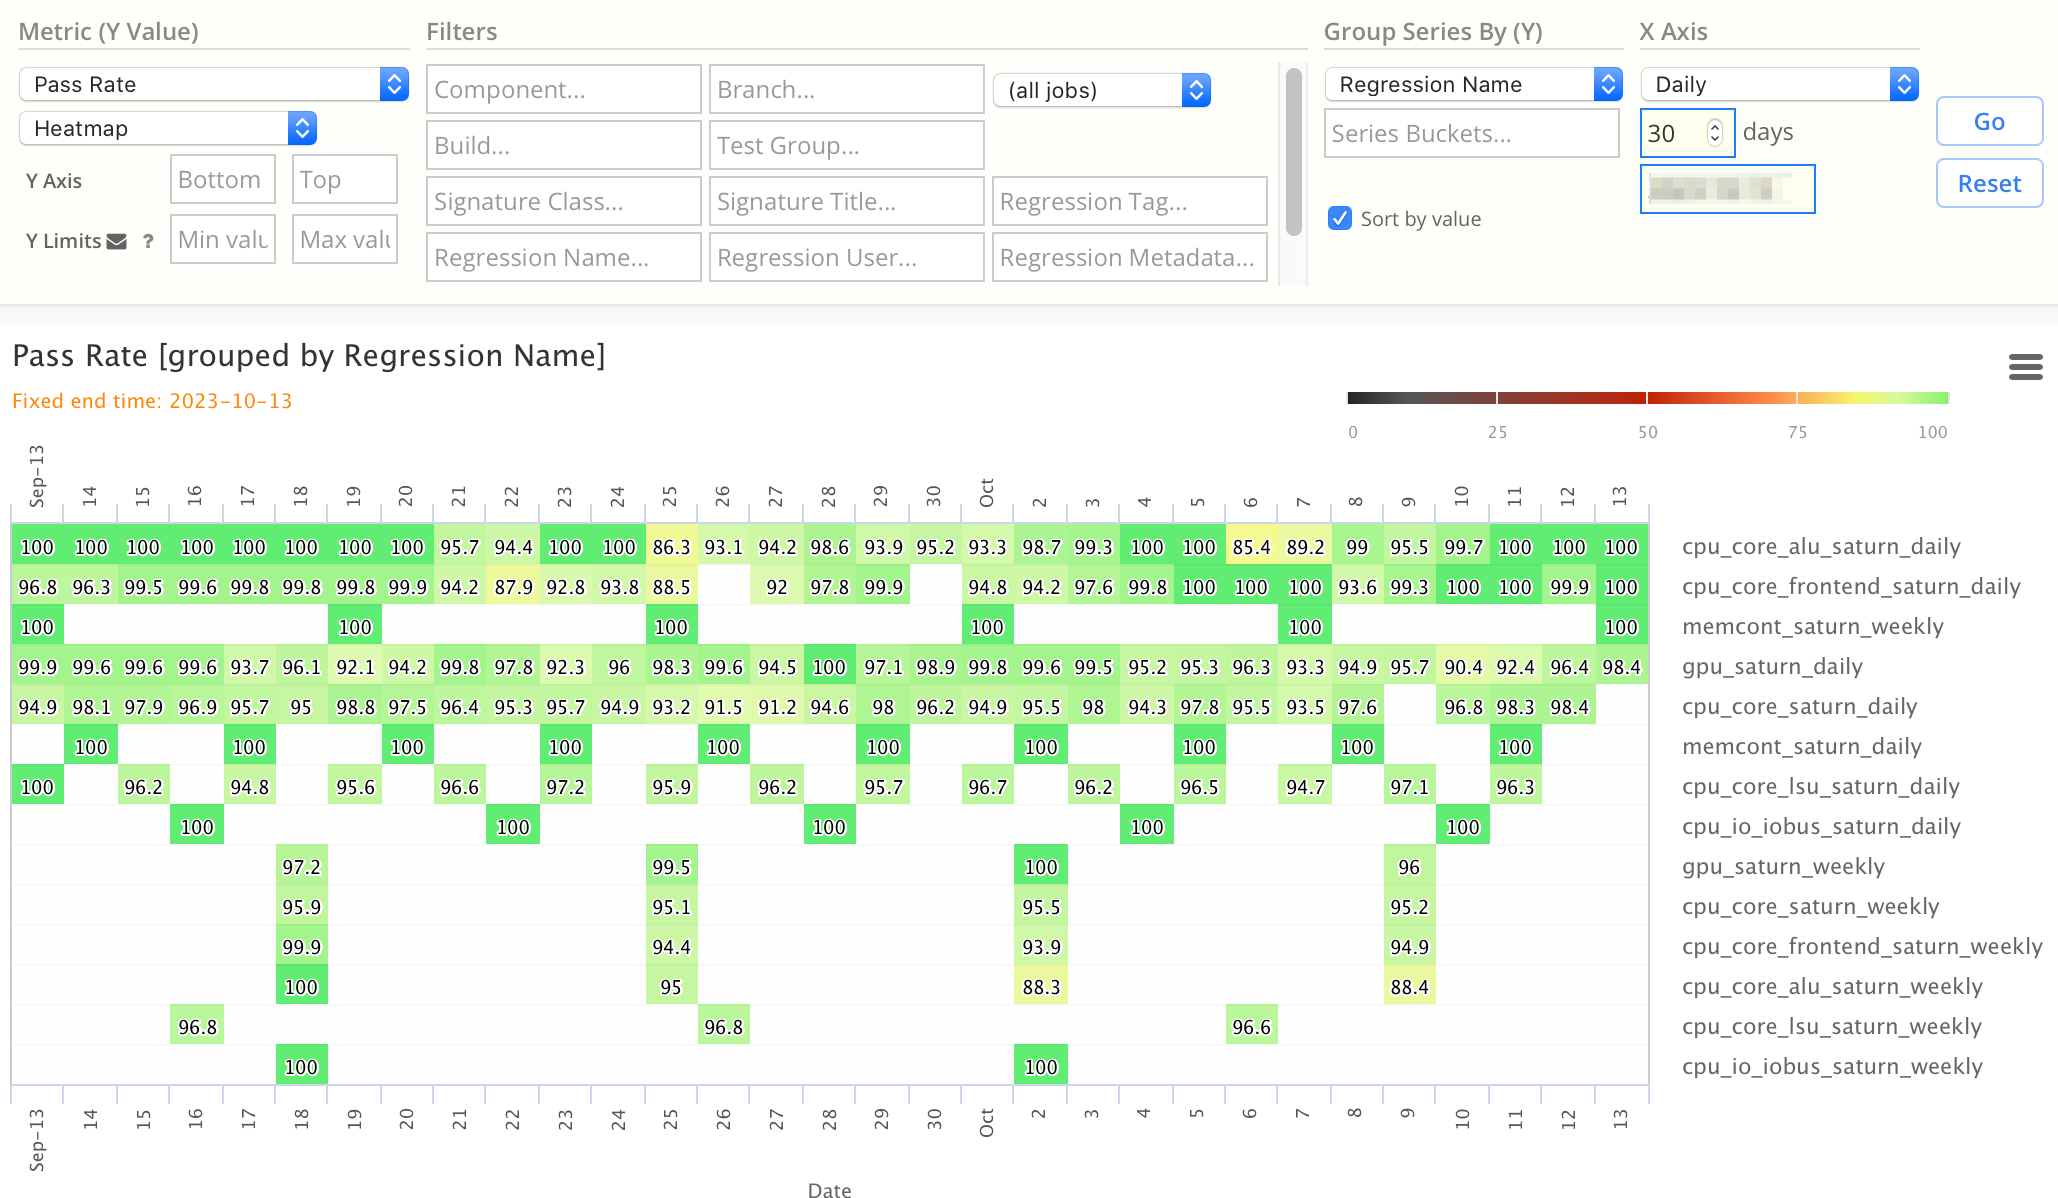
Chart Configuration:
| Chart Field | Value |
|---|---|
| Metric | Pass Rate |
| Chart Type | Heatmap |
| X Axis | Daily |
| Group Series By | Regression Name |
Daily Pass Rate by Build (Heatmap)
This is a 10-day Heatmap Chart of Pass Rate, grouped by Build.
- This lets you easily visualize the daily health of each build.
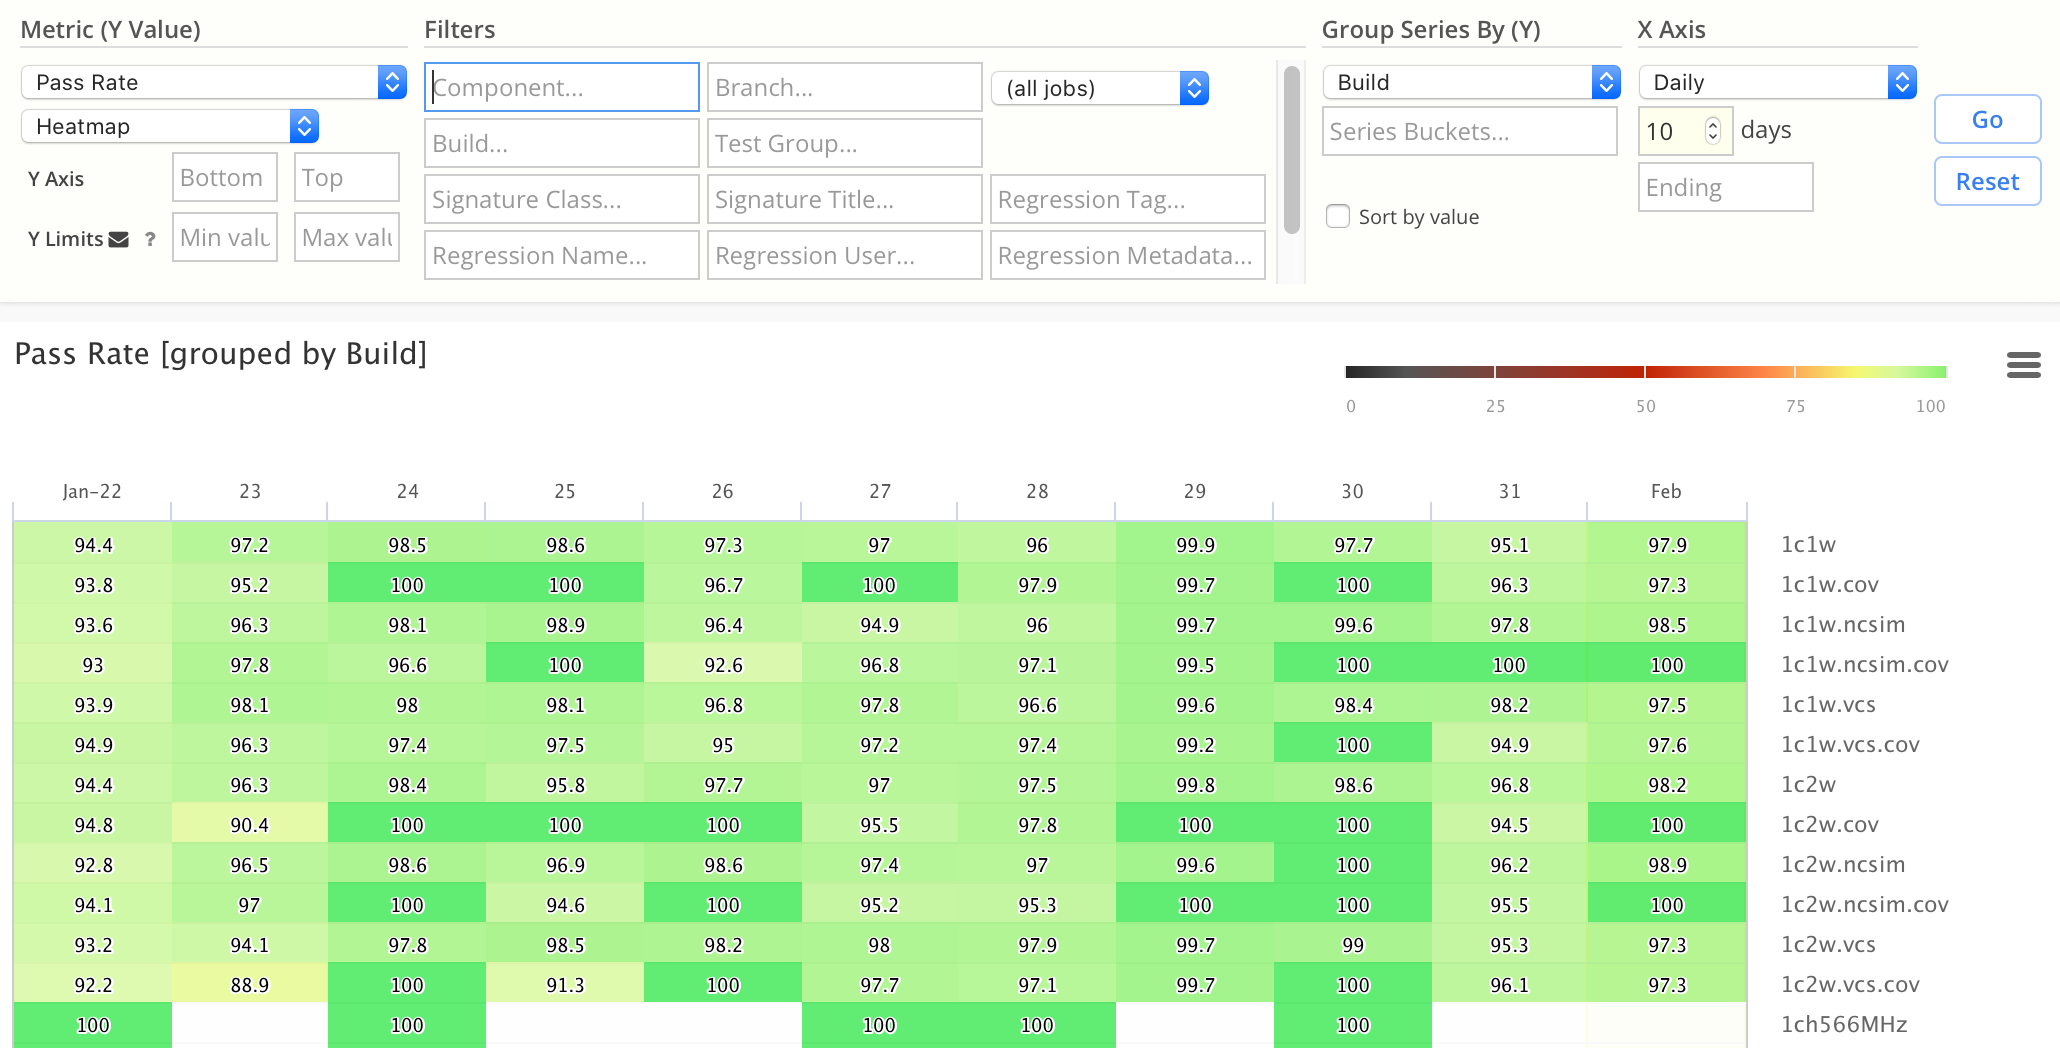
Chart Configuration:
| Chart Field | Value |
|---|---|
| Metric | Pass Rate |
| Chart Type | Heatmap |
| X Axis | Daily |
| Group Series By | Build |
Triage Rates
Simscope can chart Triage and Assignment rates (useful in line and heatmap/datatable charts).
For example, this chart shows a 14 day chart of the percentage of daily errors being triaged, grouped by Component.
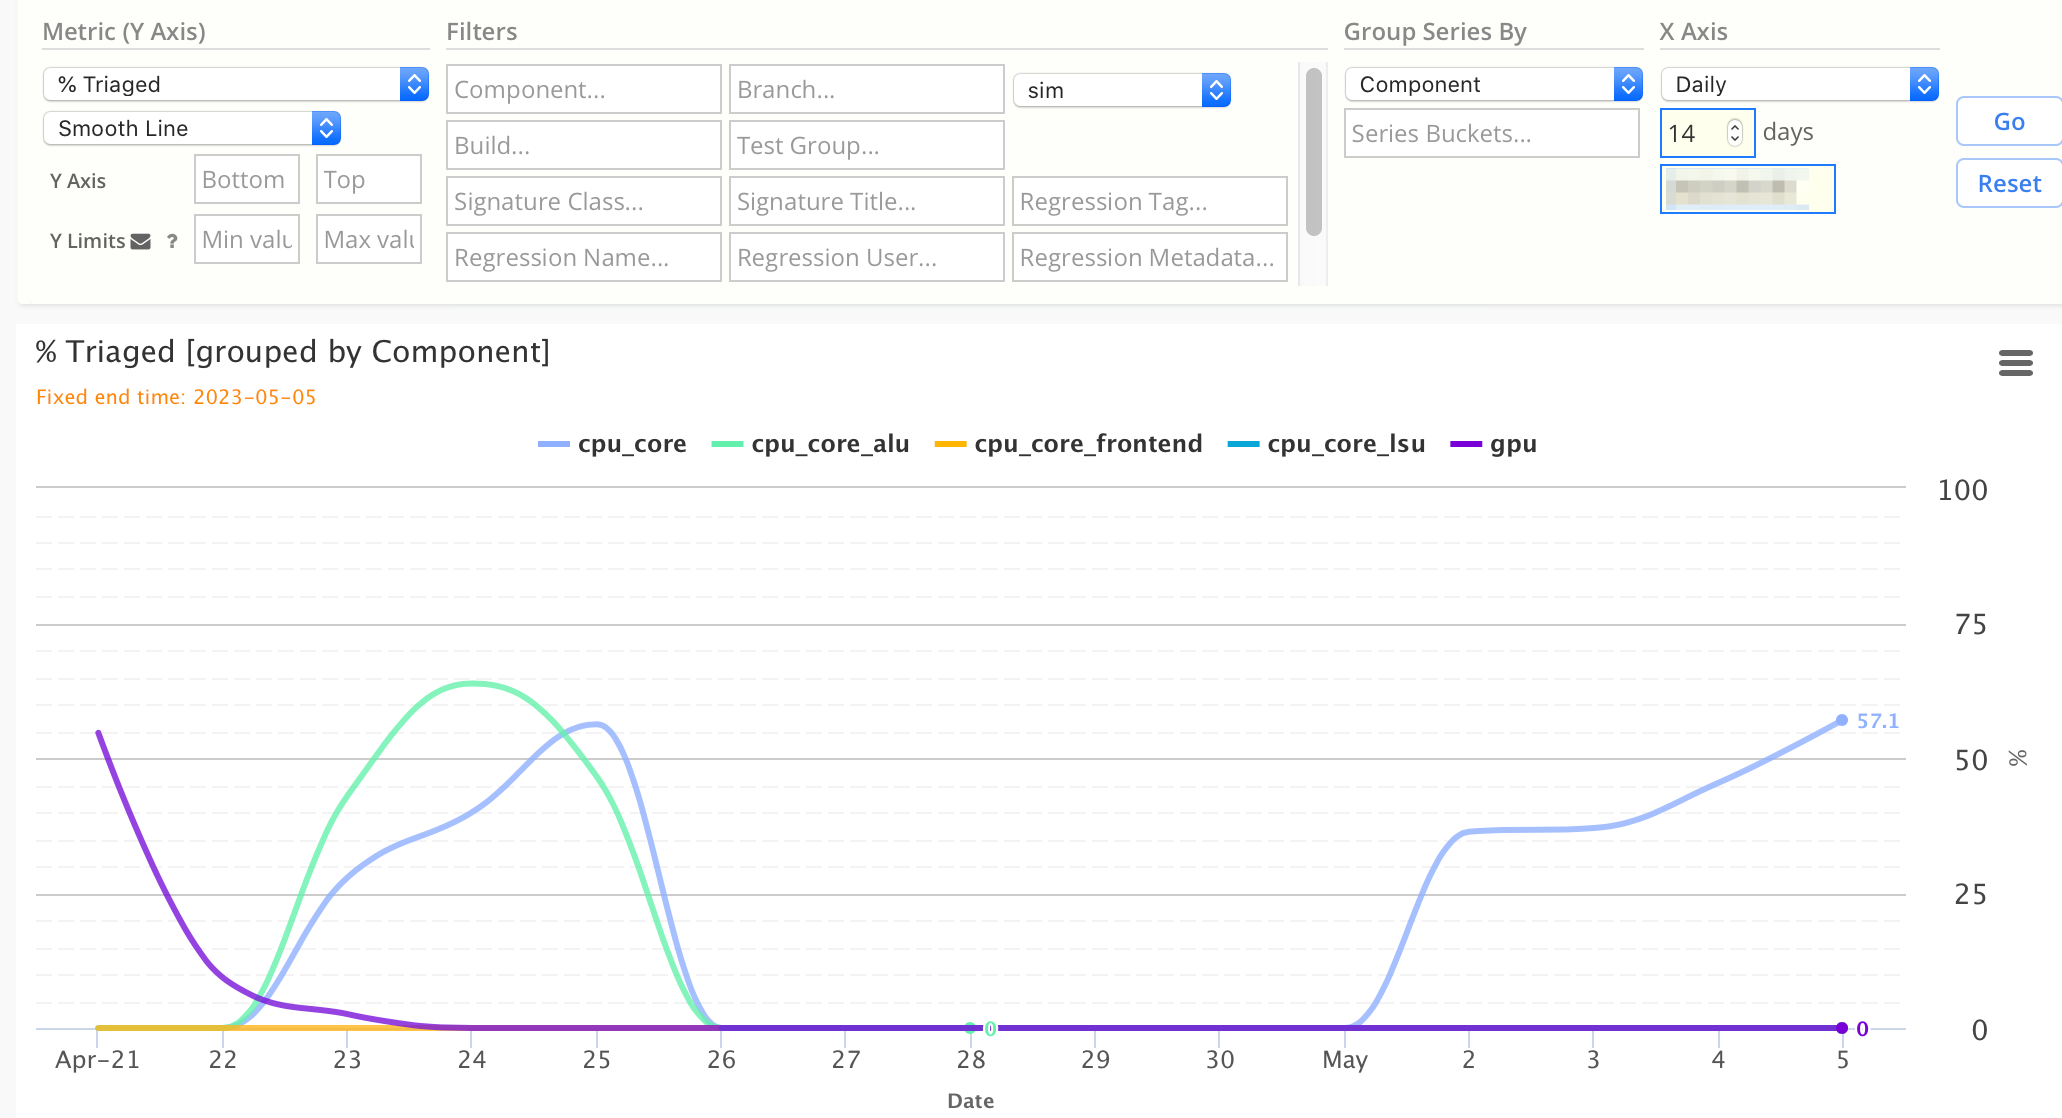
Chart Configuration:
| Chart Field | Value |
|---|---|
| Metric | % Jobs Triaged |
| Chart Type | Line |
| X Axis | Daily |
| Group Series By | Component |
Advanced: Regression Coverage Heatmap
If you are storing coverage values inside of Regression Metadata, you can create coverage charts with Simscope.
This example plots func coverage for all weekly regressions, across multiple components,
for a 30-day period:
- X-axis is grouped by model version (ie SHA).
- For example, you can see multiple regression coverage results for checkin
b2ffd(see the red arrow)
- For example, you can see multiple regression coverage results for checkin
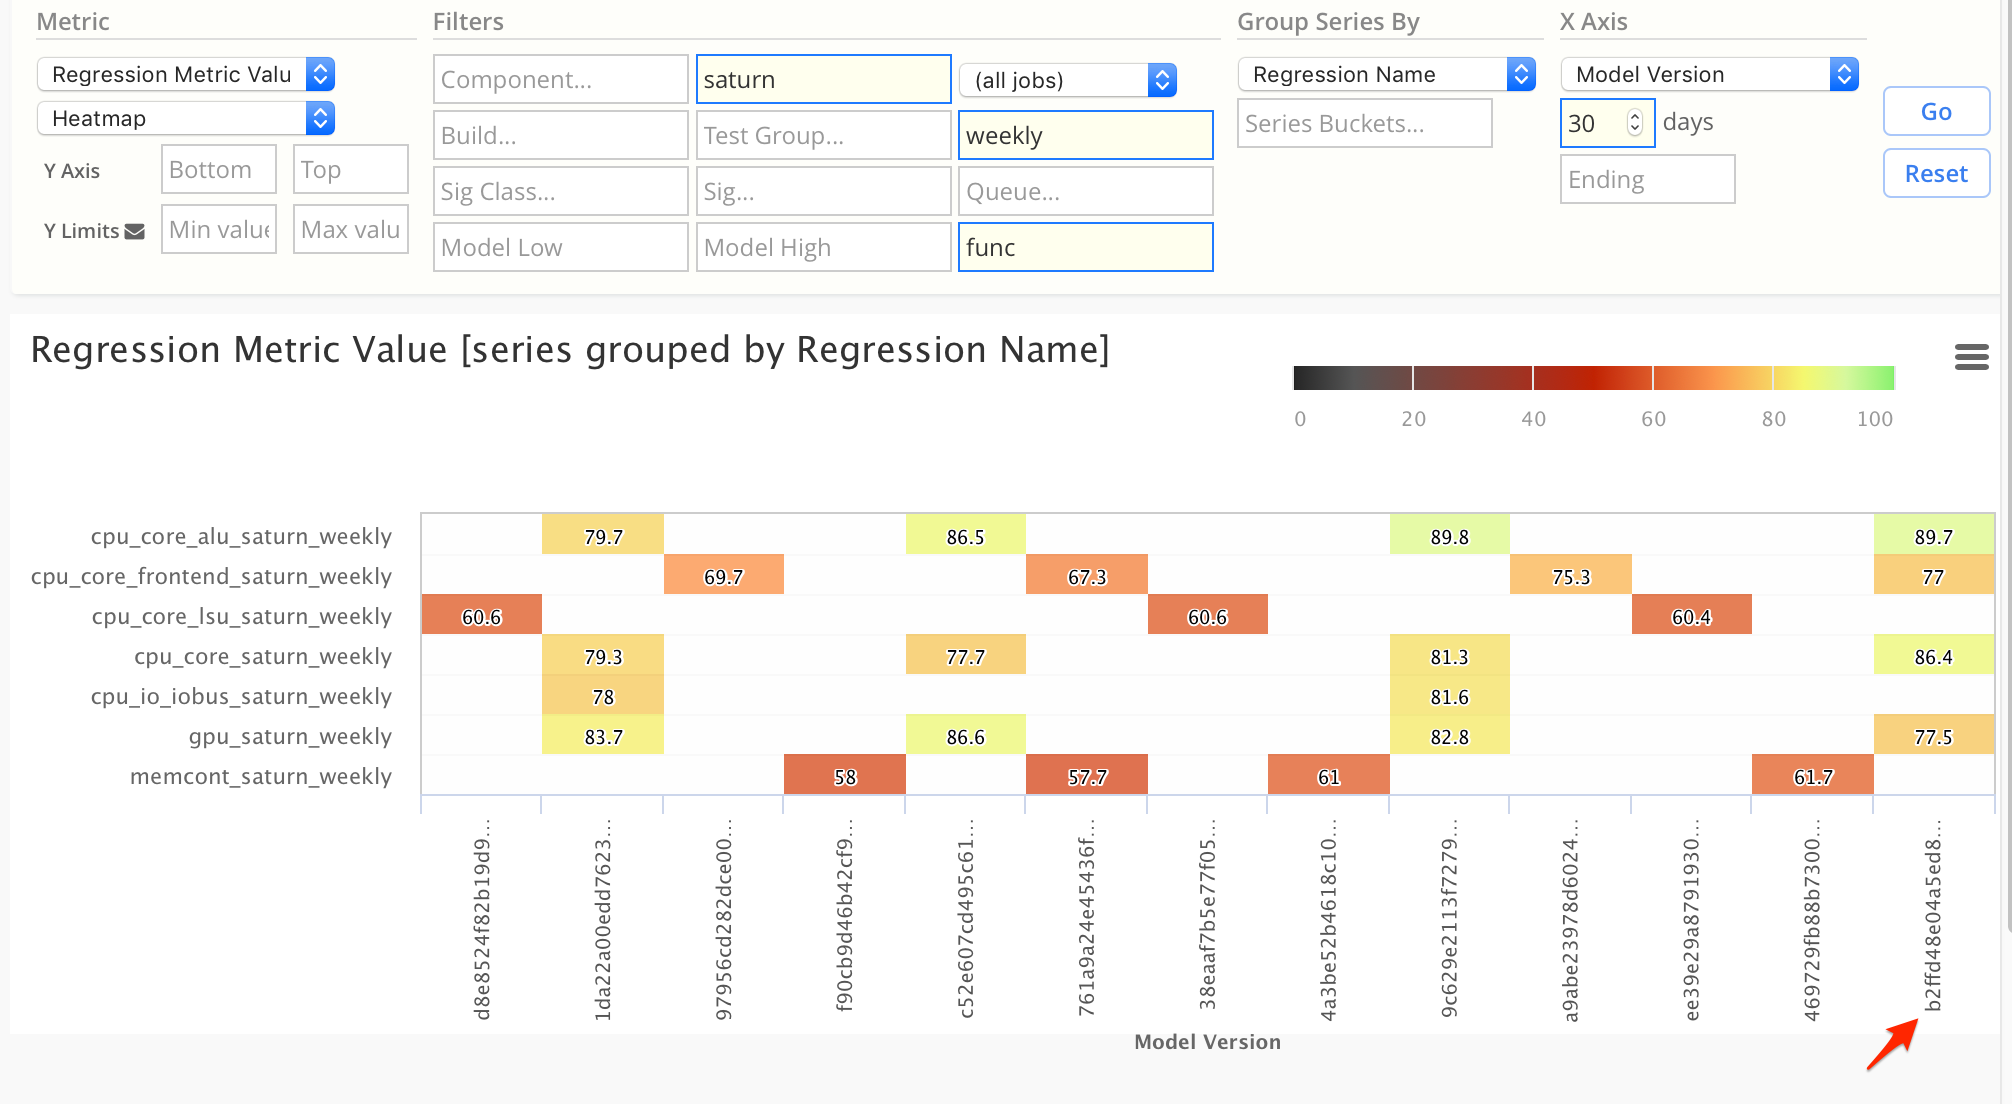
Chart Configuration:
| Chart Field | Value |
|---|---|
| Metric | Regression Metric Value |
| Chart Type | Heatmap |
| X Axis | Model Version |
| Group Series By | Regression Name |
| Regr Metadata | (enter a specific coverage series name) |
| Component | (enter a regex) |
| Regression Name | (enter a regex) |
Advanced: Regression Coverage by Model
If you are storing coverage values inside of Regression Metadata, you can create coverage charts with Simscope.
This example plots coverage values for a specific model version (ie checkin):
- Model Version (SHA)
b2ffd - Notice you can see both
func_coverageandline_coveragefor all regressions in one chart
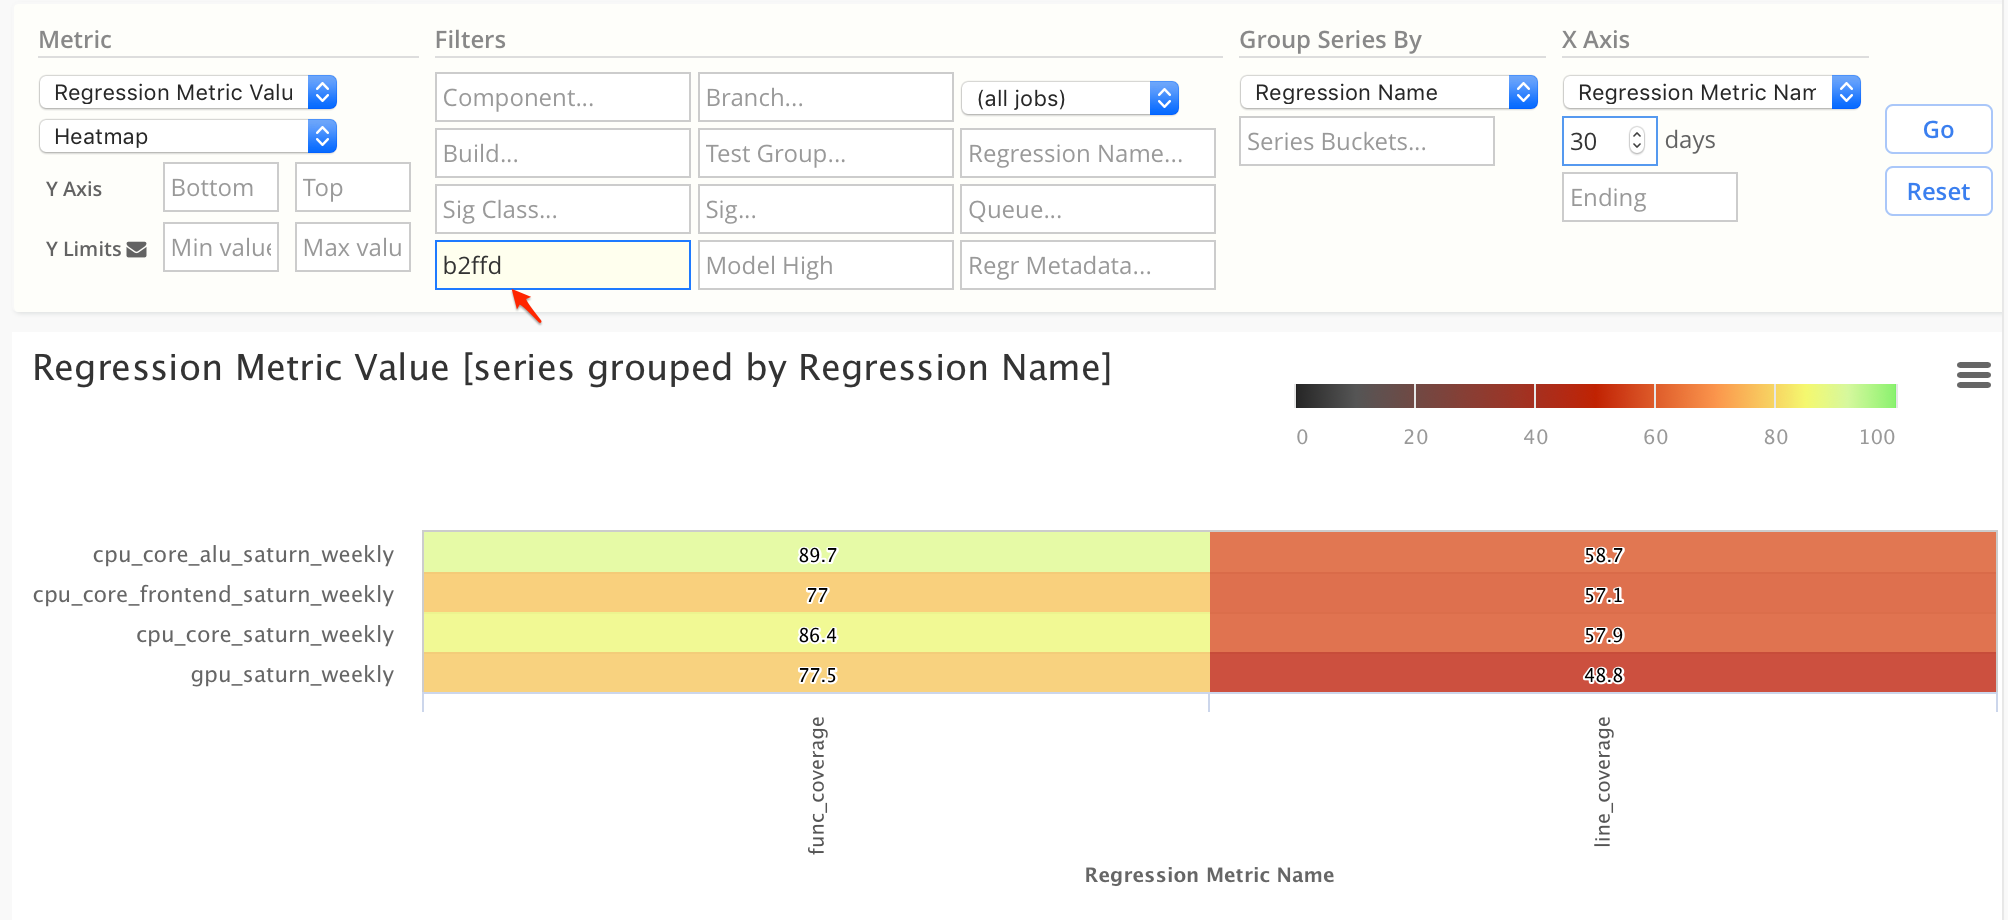
Chart Configuration:
| Chart Field | Value |
|---|---|
| Metric | Regression Metric Value |
| Chart Type | Heatmap |
| X Axis | Regression Metric Name |
| Group Series By | Regression Name |
| Model Low | (enter a model version/SHA) |