Chart Y Limits — Email Notifications
Saved Charts can optionally be set up with minimum and/or maximum value limits, and send automatic email notifications.
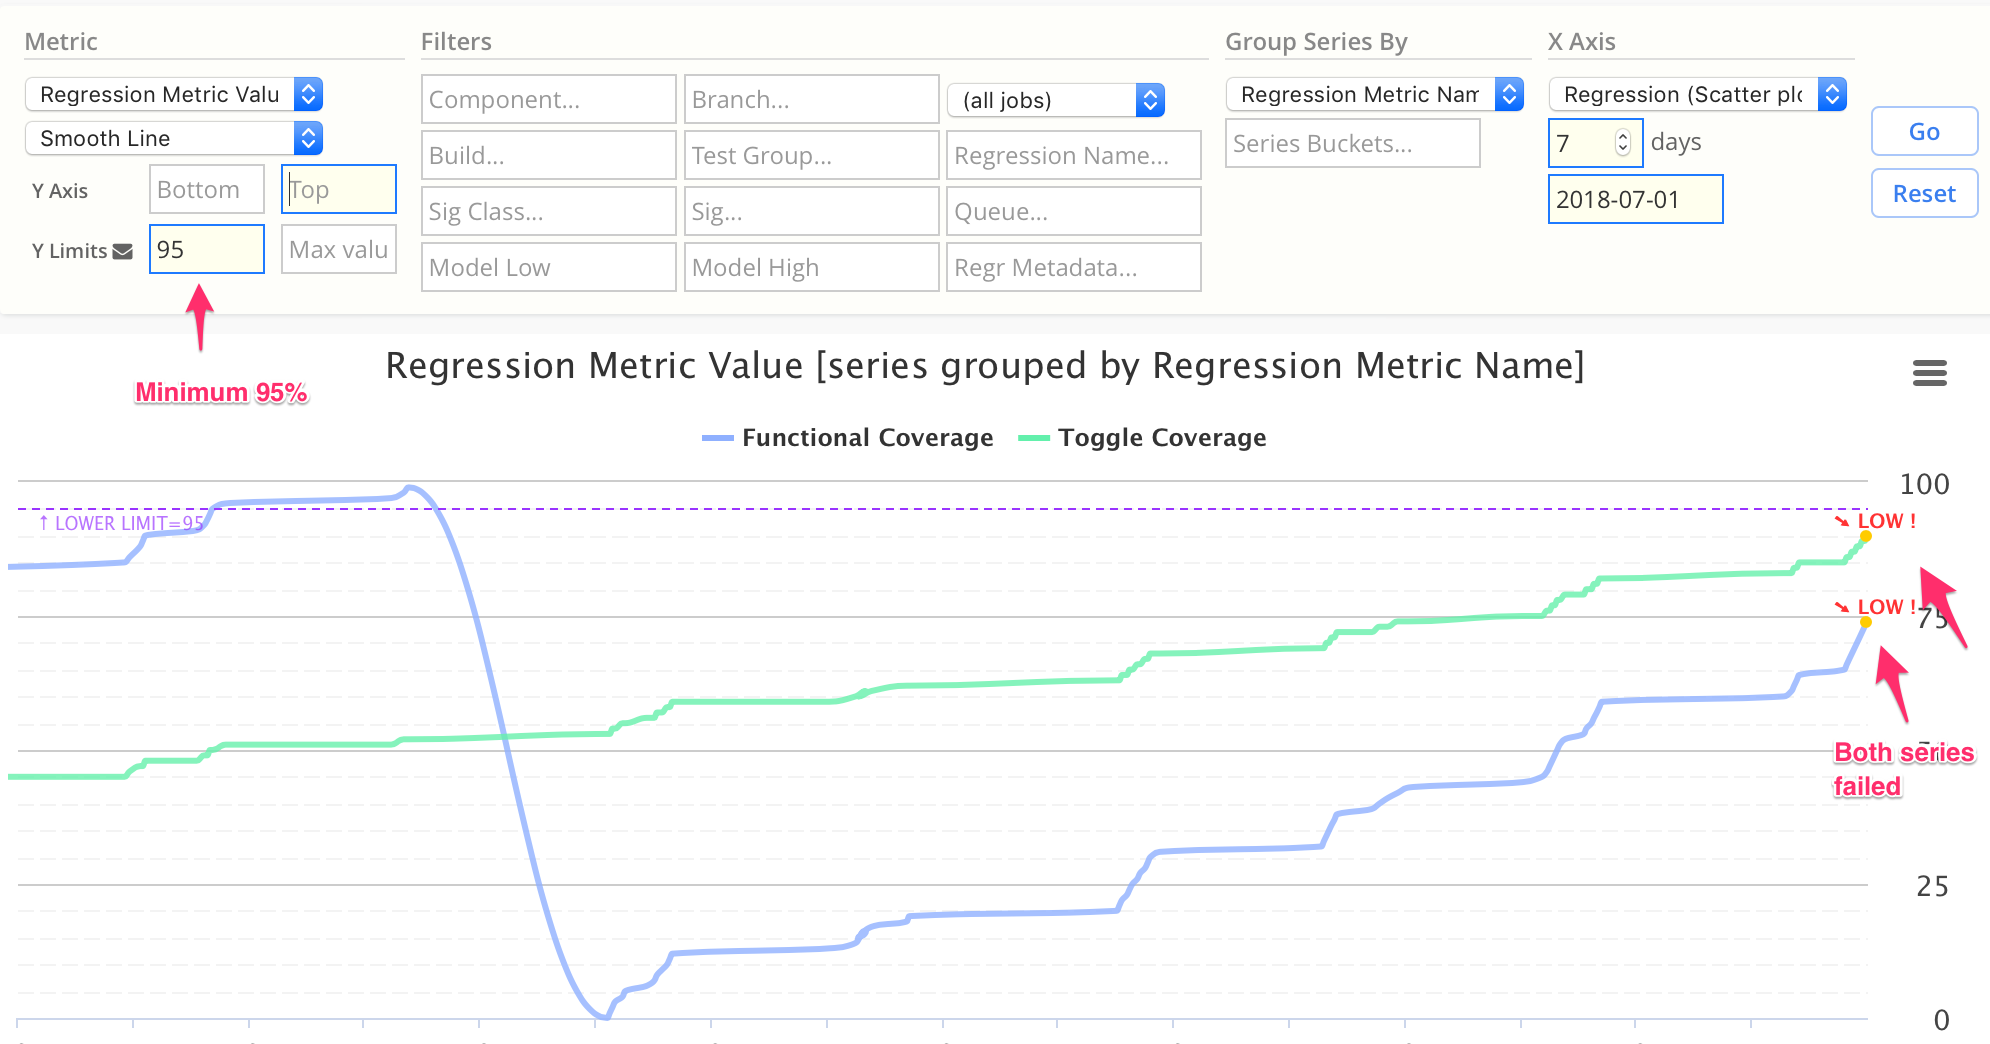
This example chart will notify if regression coverage is below 95%.
Y Limits
Chart Y Limits can be set as:
- Minimum value
- Maximum value
- Bounded (between minimum and maximum)
- Wildcard (
*) — asterisk
If the chart data is detected outside the limits, the creator of the chart will automatically get a notification email.
Users can set up threshold limits on charts, if they want to be notified with an email if a chart goes outside of the bounds.
Note: chart limits are currently only checked once a day, usually in the morning (ie 7am).
Chart Limit Scenarios
Charts can either:
- Not check limits (default — no emails)
- Send on fail
- Send on pass/fail
- Wildcard, send always (always pass)
Wildcard Limit — *
If either min or max limit are set to * (asterisk), this will change chart limit behavior
to send daily emails on both pass and fail events.
If left as blank value, Simscope keeps the prior behavior, where emails are only sent if a limit fails.
Limit Values
The min and max limits can be blank, set to a number, or set to wildcard.
| Limit Value | Example | Meaning |
|---|---|---|
| Blank | Blank (empty) string value. No limit (and no notification). | |
| Number | 95.1 | Numeric limit value. Send fail email if chart value is outside this value. |
| Wildcard | * | Send pass email if value is within limit. |
Limit Notification Behavior
Here is a table of limit configurations and whether they send emails.
| Limit Min | Limit Max | Pass Email | Fail Email | Comment |
|---|---|---|---|---|
| . | . | . | . | Default — no limits |
| . | * | ✅ | . | Wildcard: notify always (note the chart always passes) |
| . | Number | . | ✅ | Maximum value chart — notify if above maximum |
| Number | . | . | ✅ | Minimum value chart — notify if below minimum |
| * | Number | ✅ | ✅ | Maximum value — notify on both pass/fail |
| Number | * | ✅ | ✅ | Minimum value — notify on both pass/fail |
Pass Rate Example
For example, you can create a Pass Rate chart on a series of daily regressions, and
set a minimum limit value of 0.95 (ie 95%).
- If the regressions hit
93%, you would get an email. - If
95%or higher, no email is sent.
Example Chart with Limits
This example has set a Pass Rate minimum of 95% with pass notifications enabled.
- If below 95%, the user will get a Fail email.
- If 95% or higher, the user will get a Pass email.
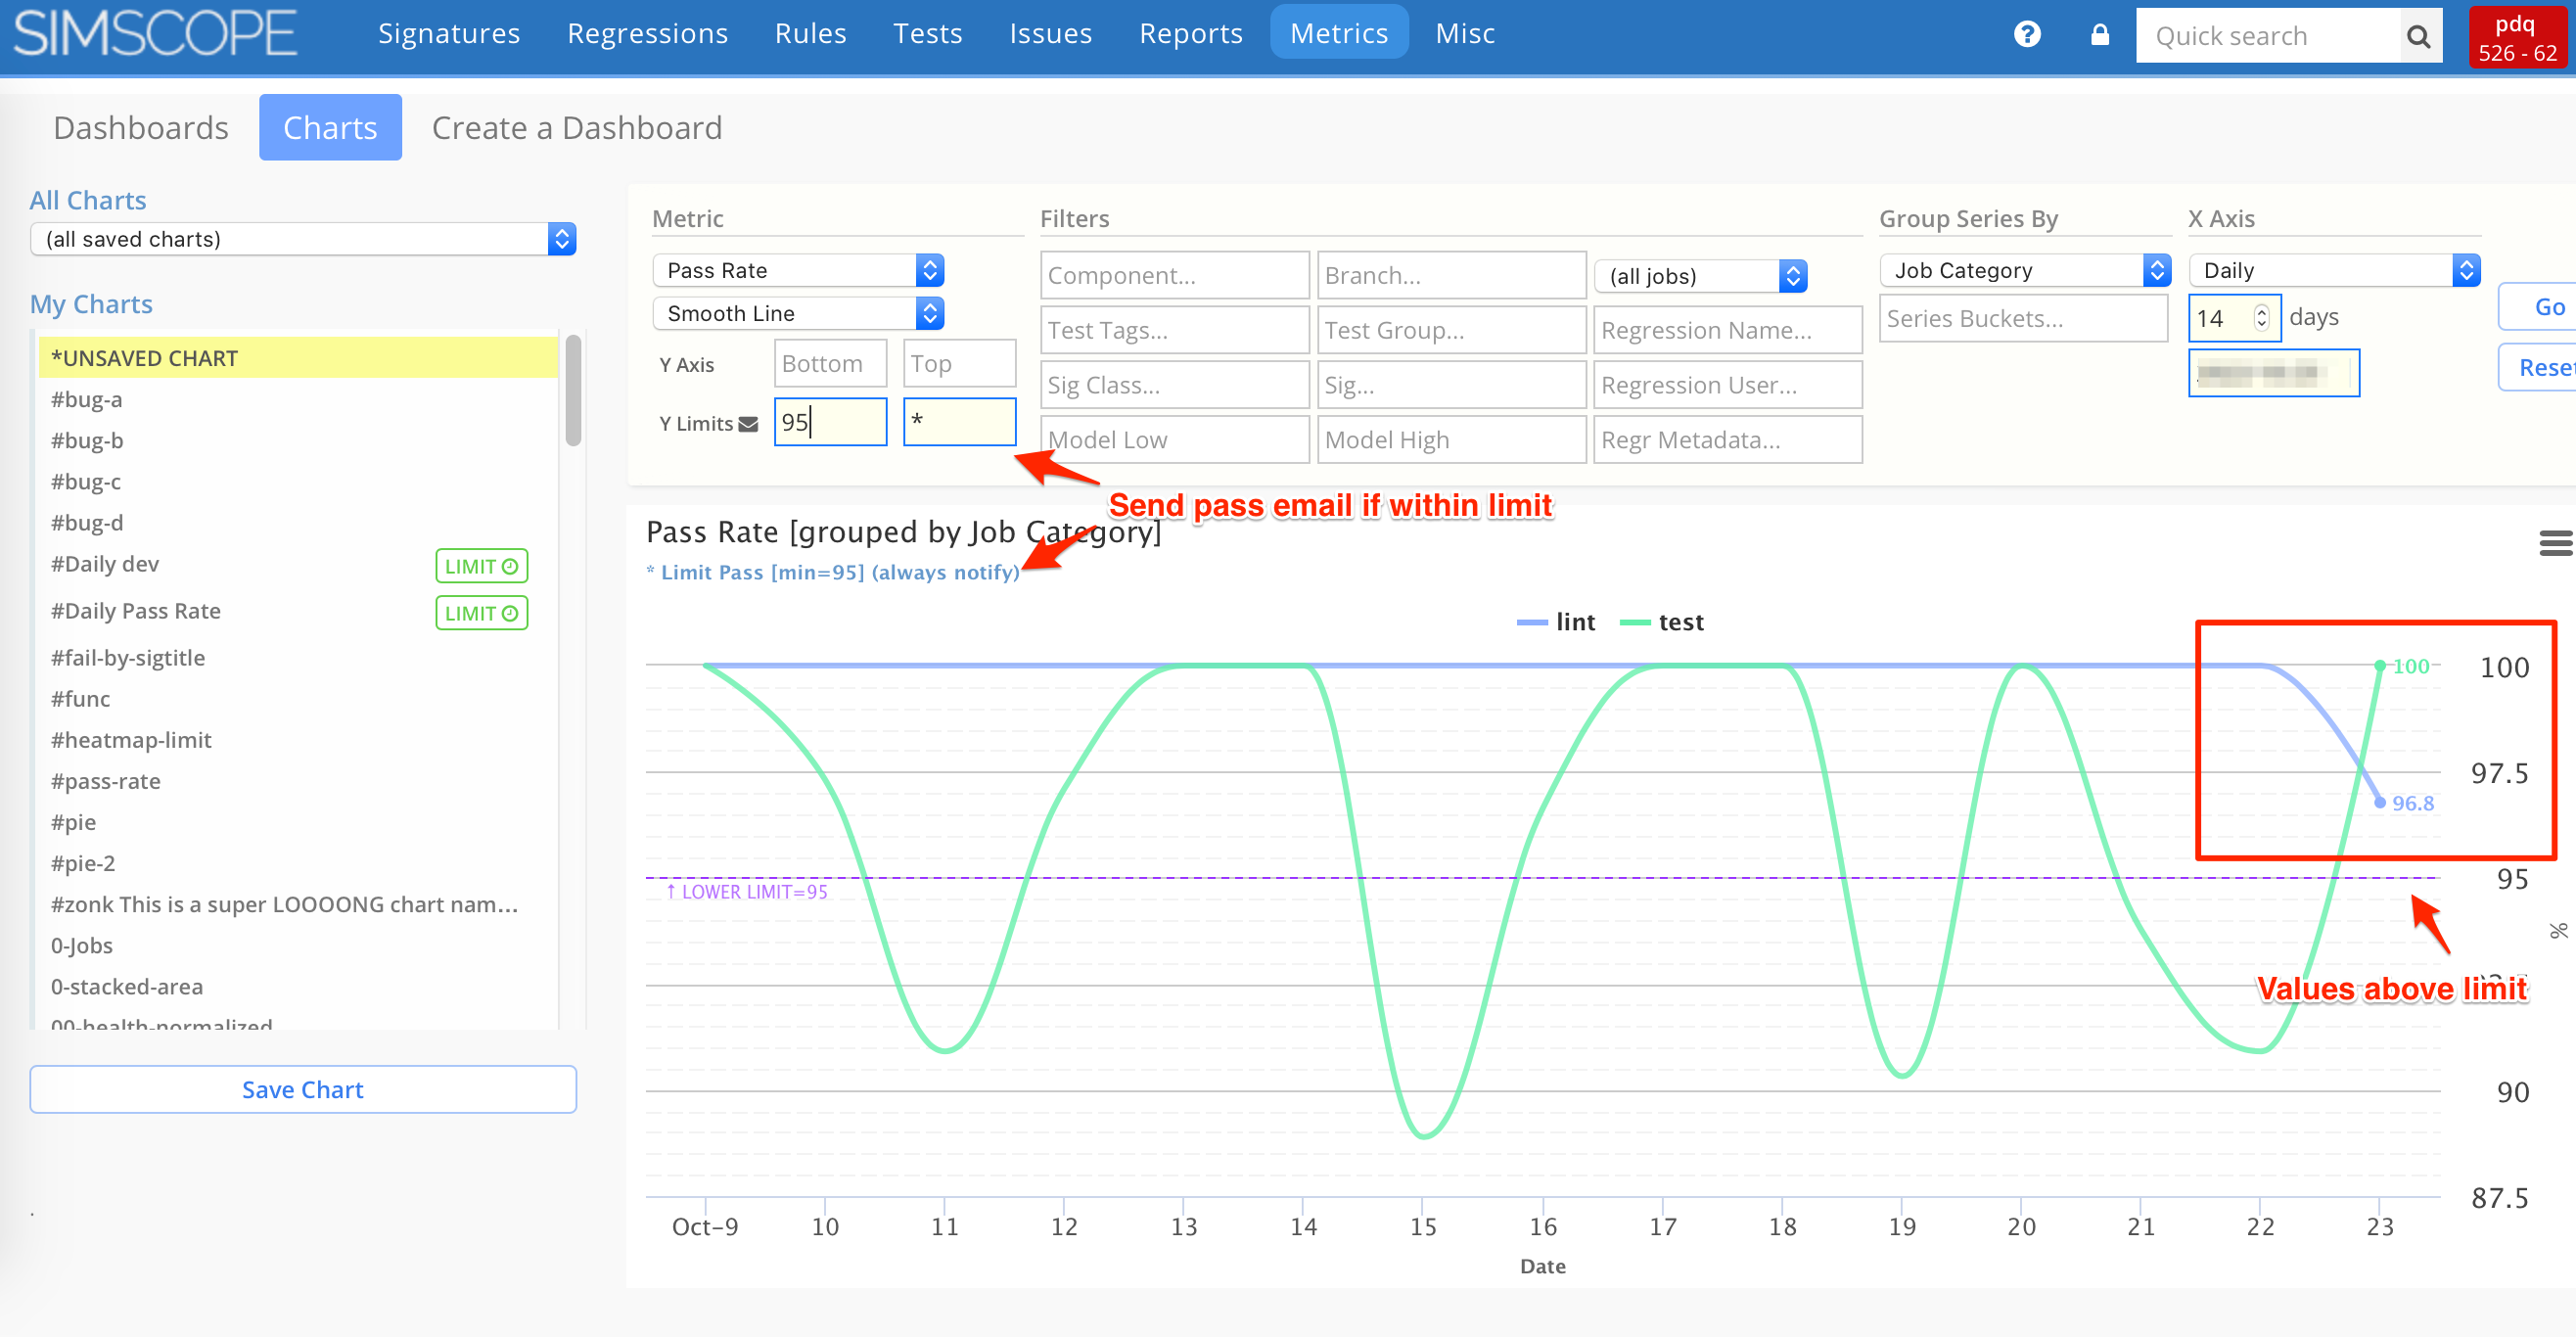
→ With this example chart data, the user will get a Pass email, due to the pass rates being above the 95% limit.
Email Notification Example
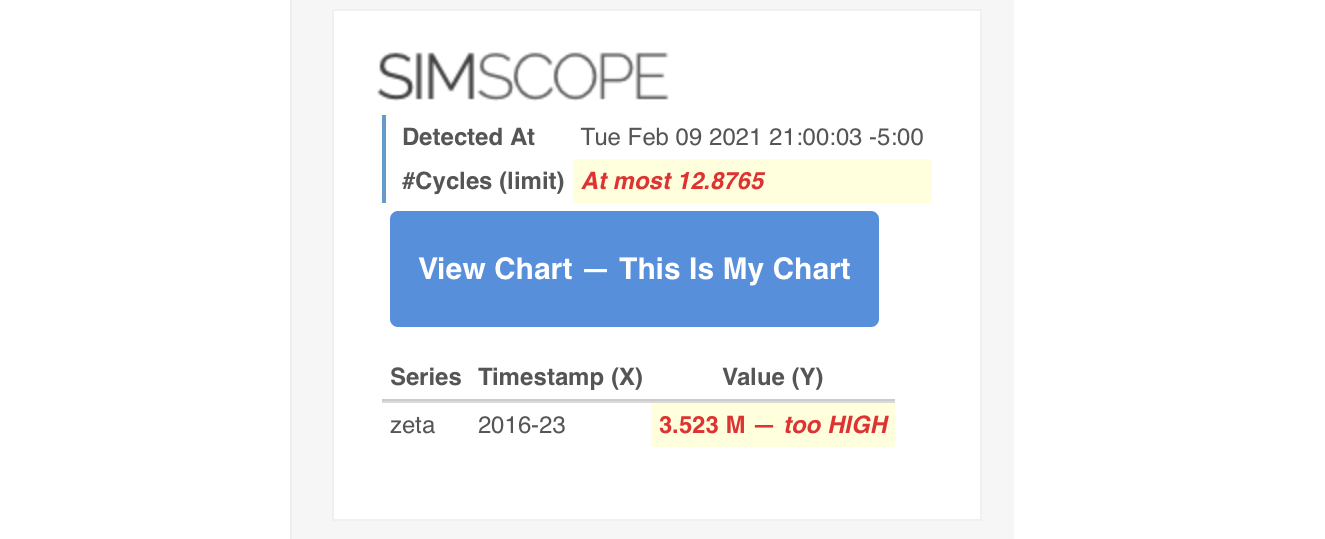
This is an example limit failure email notification:
Email CC
By default, chart notifications are emailed only to the user who created the chart.
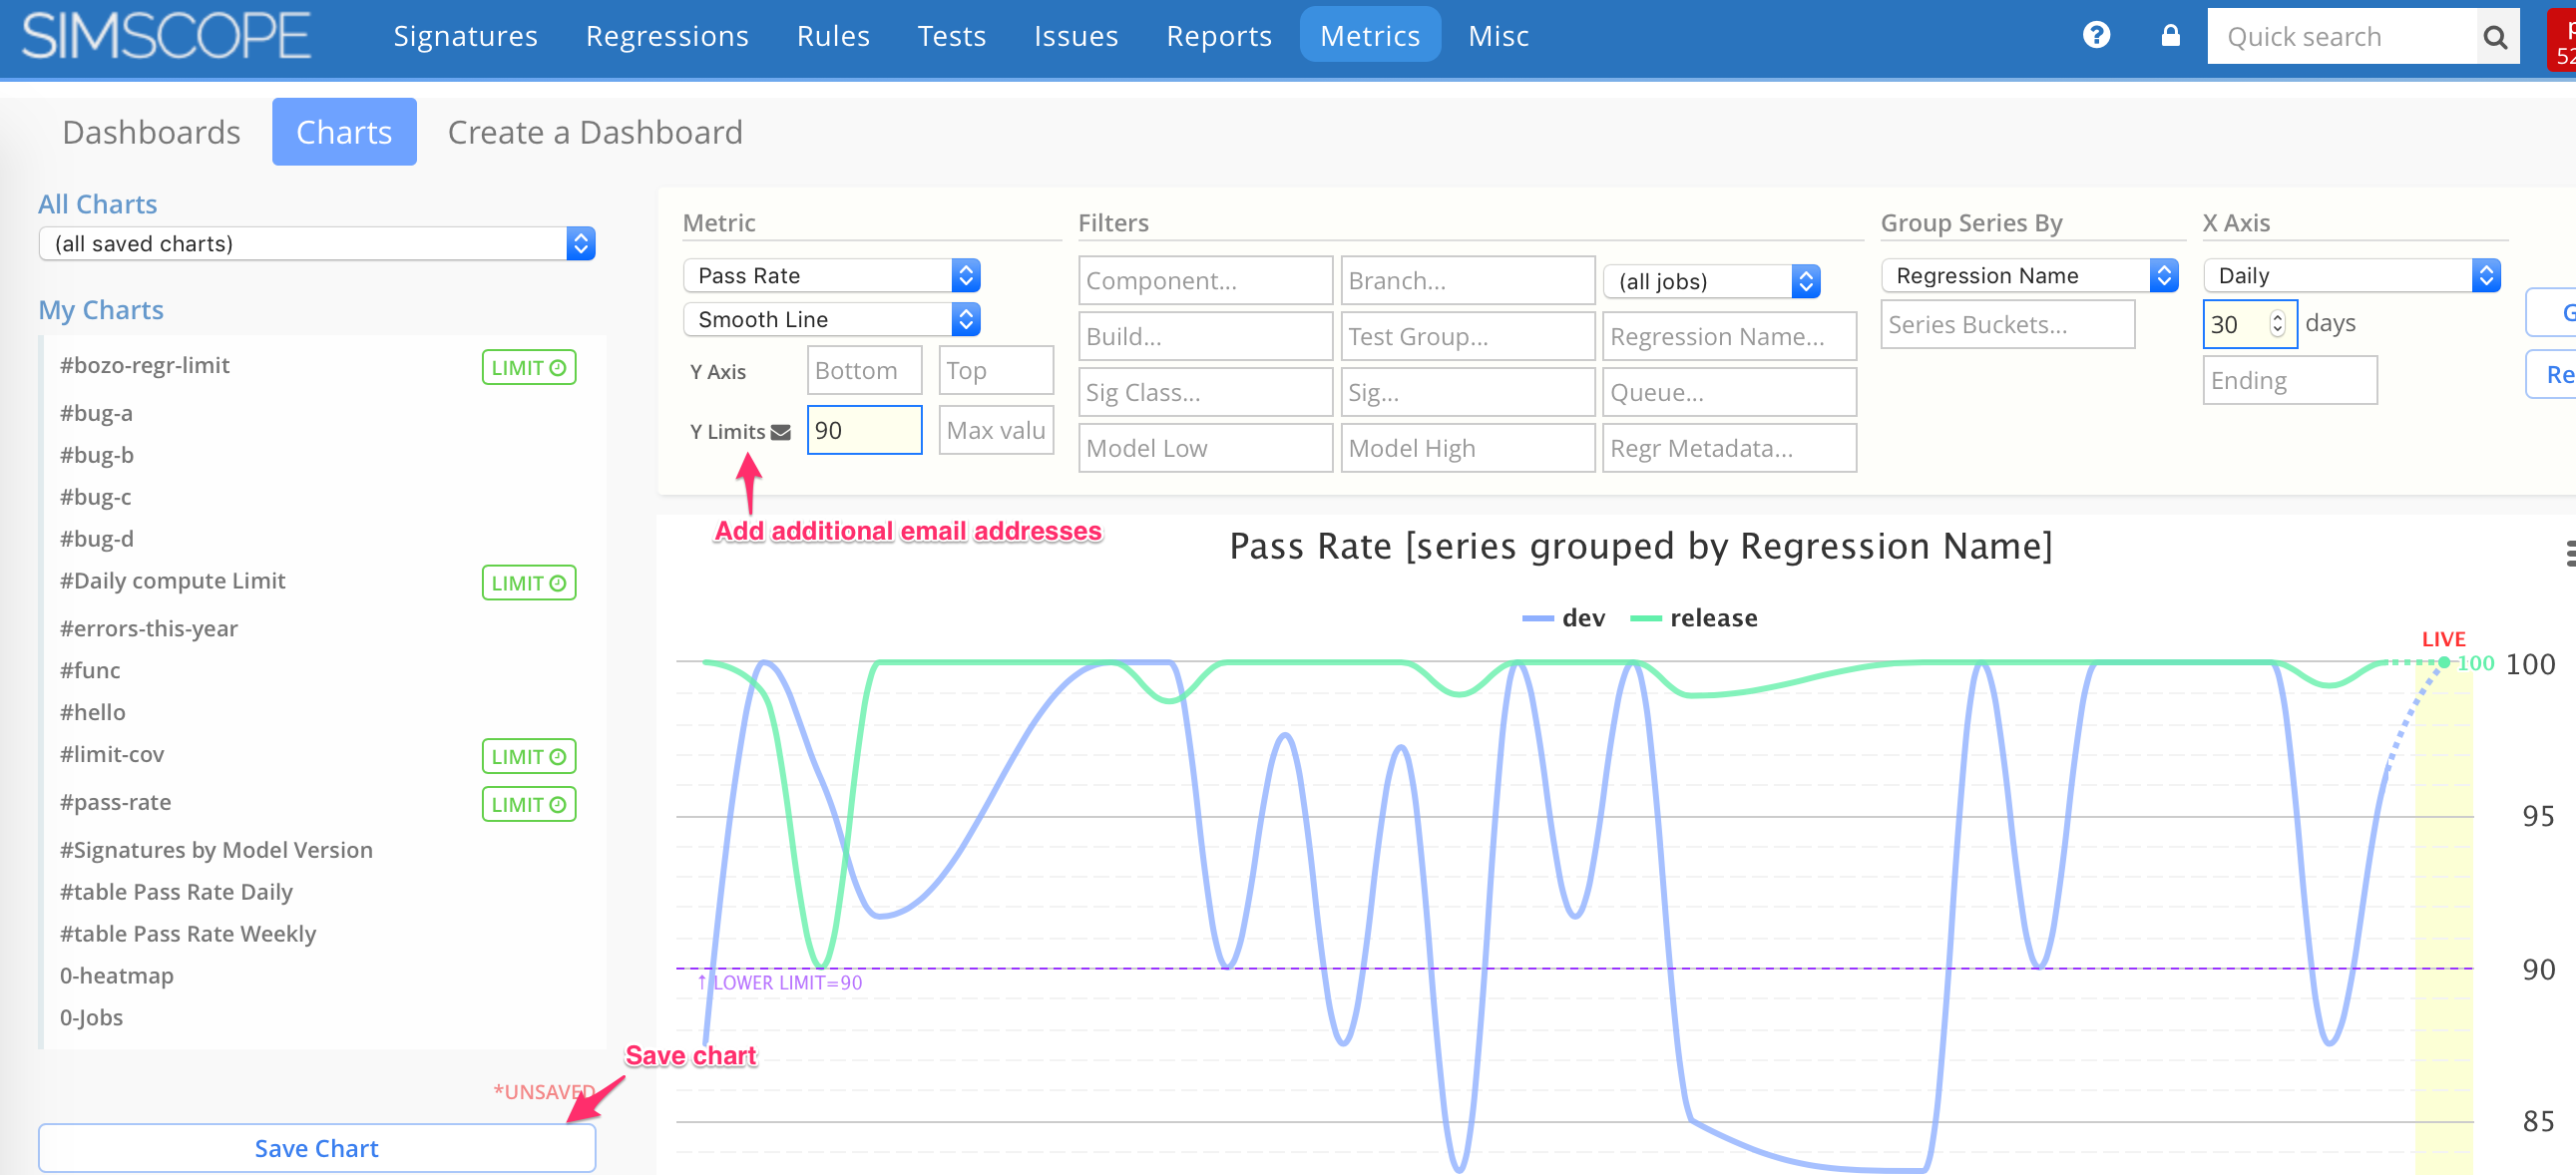
To optionally add additional email CC (carbon copy) to notify others of chart limit failures:
- Click the blue mail envelopen icon next to Y Limits.
- Type in one or more email addresses, separated by commas.
- Note: you must Save the chart after adding the CC.
Notification Check Time
Charts are checked for limit values once per day.
- Admins: See simscope.config
[chart]
# Enable daily checks (occur once per day).
# NOTE: this time is used for Regression Watch, Signature Watch, and Daily Charts.
autocheckschedule = "07:00 CST"
Note: since charts are only checked once per day, so if a chart goes outside of the bounds and is back within bounds when the check occurs, you will not get a notification.