Line Charts
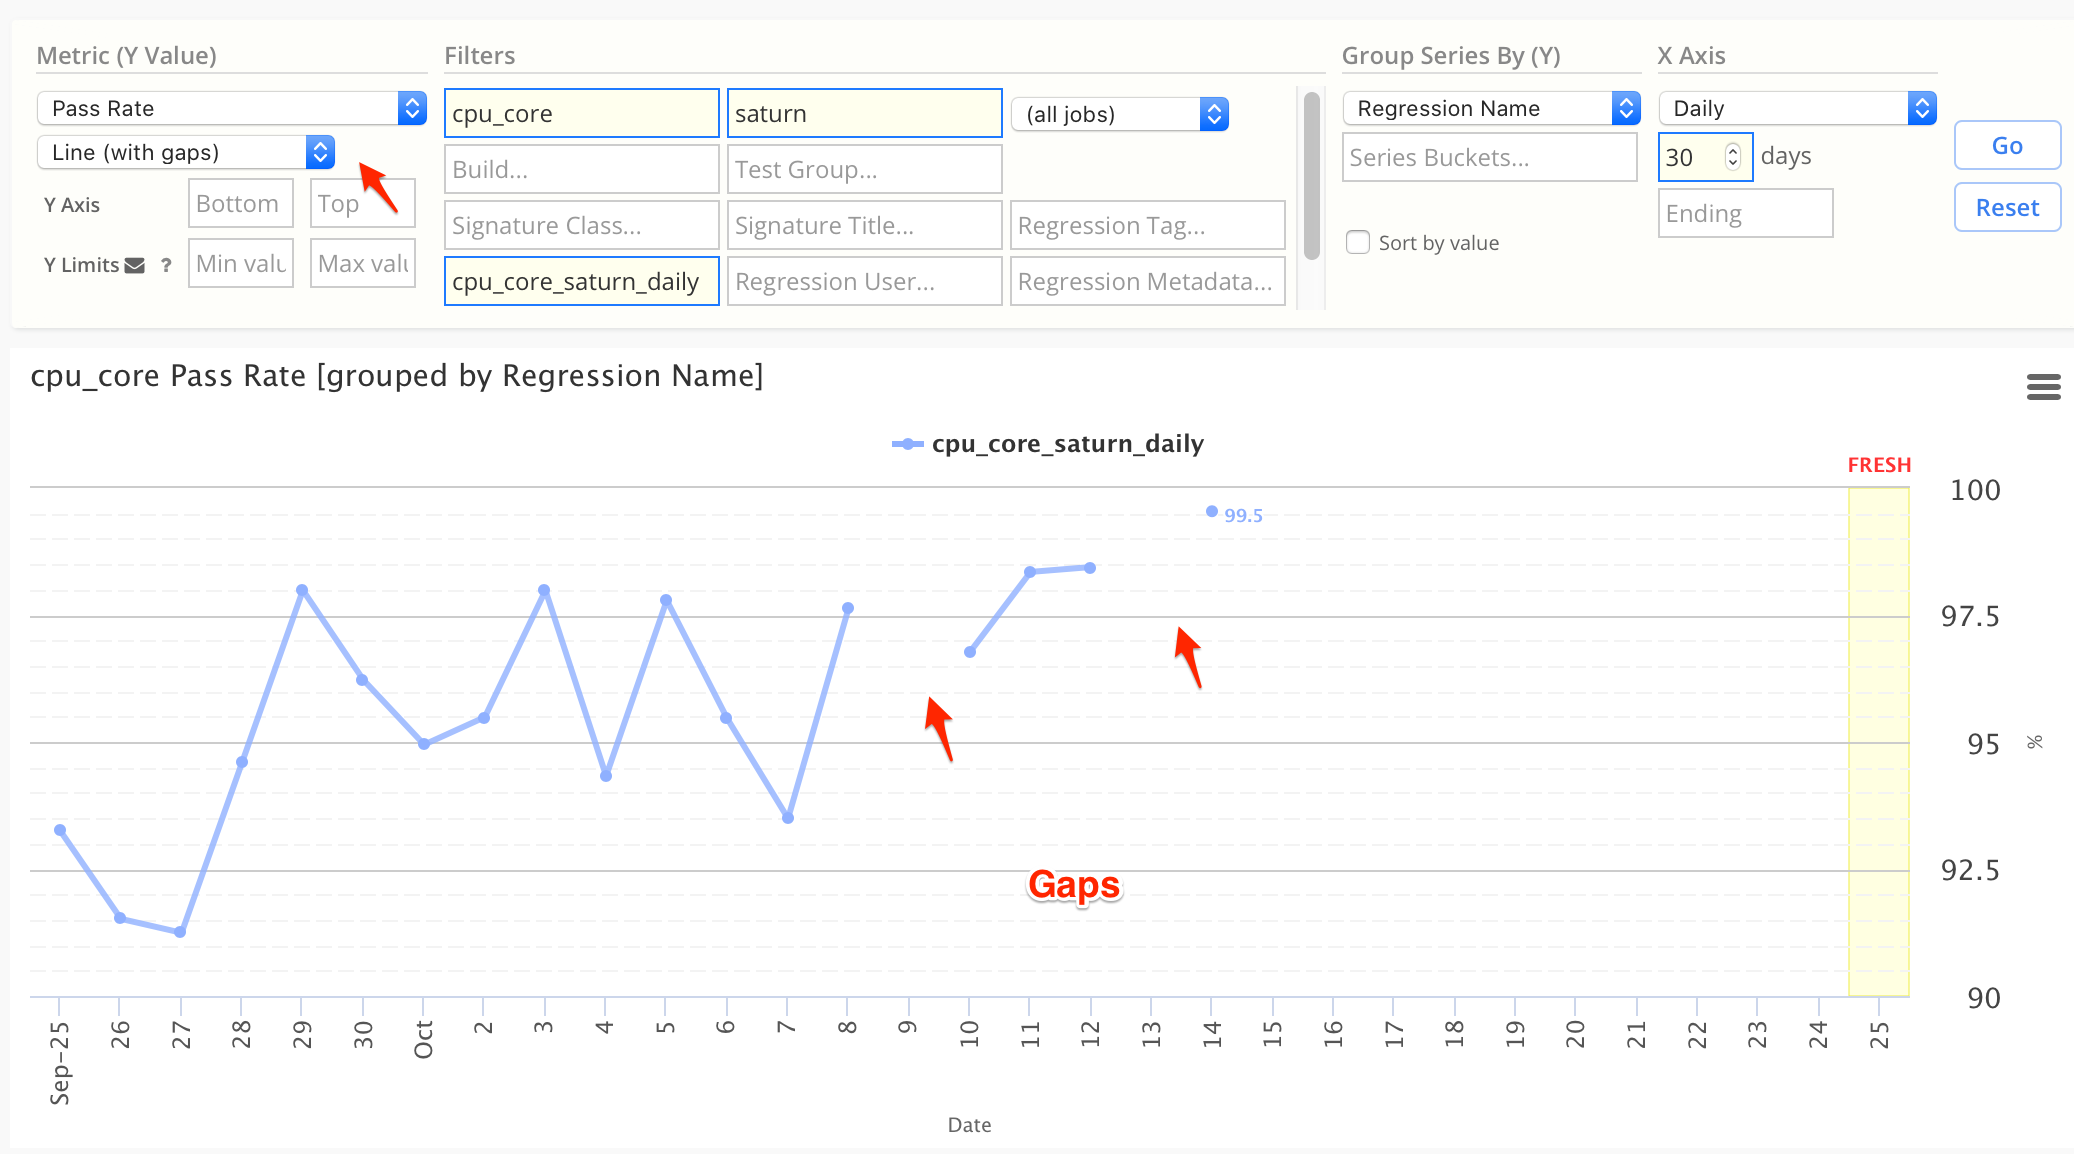
The default chart is Line (with gaps), which will leave gaps where days have holes (missing data).
Line (with gaps)
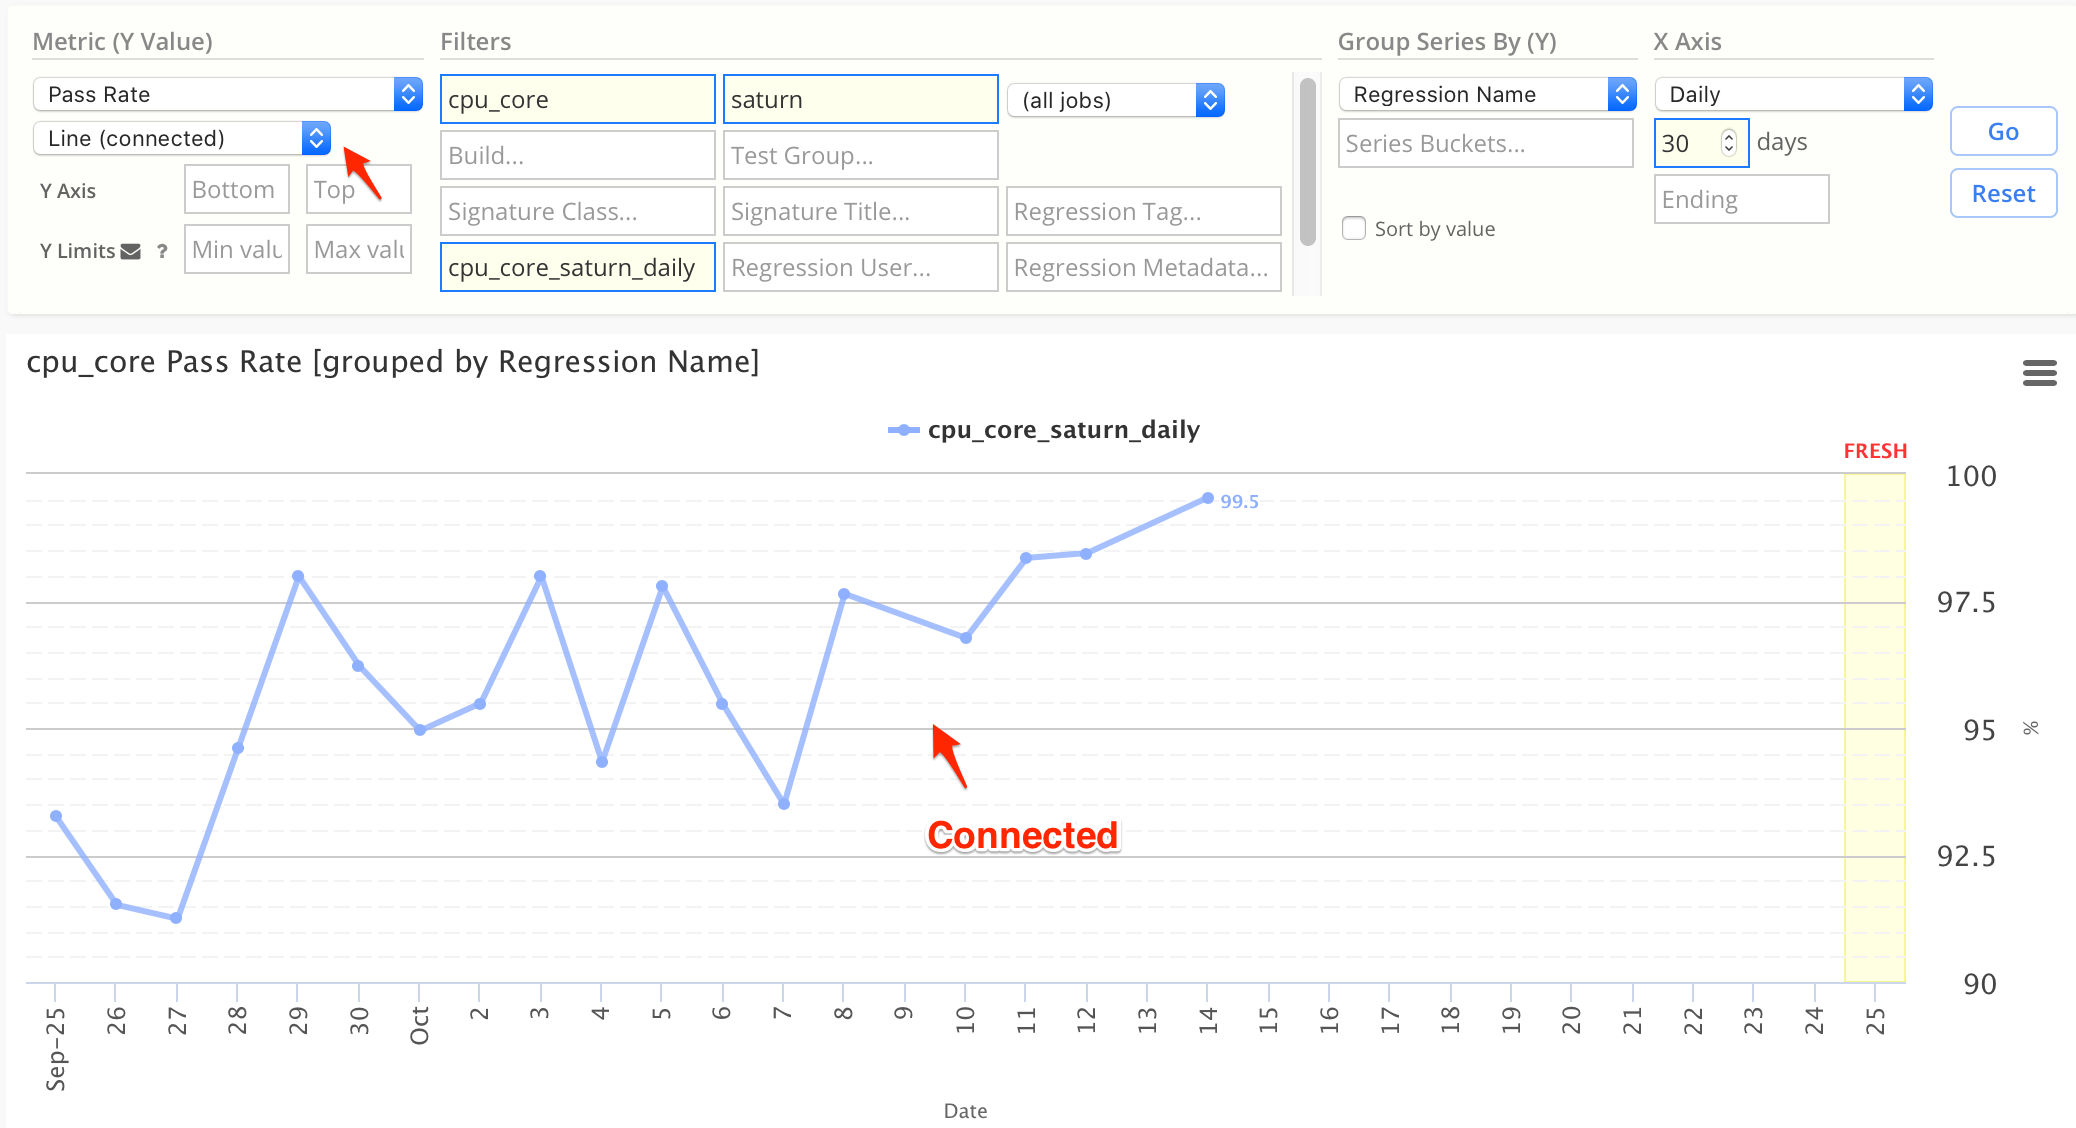
Line (connected)
Connected line charts connect missing data, but can be misleading if you are expecting data.
- This is the same chart as above, except the holes are connected.
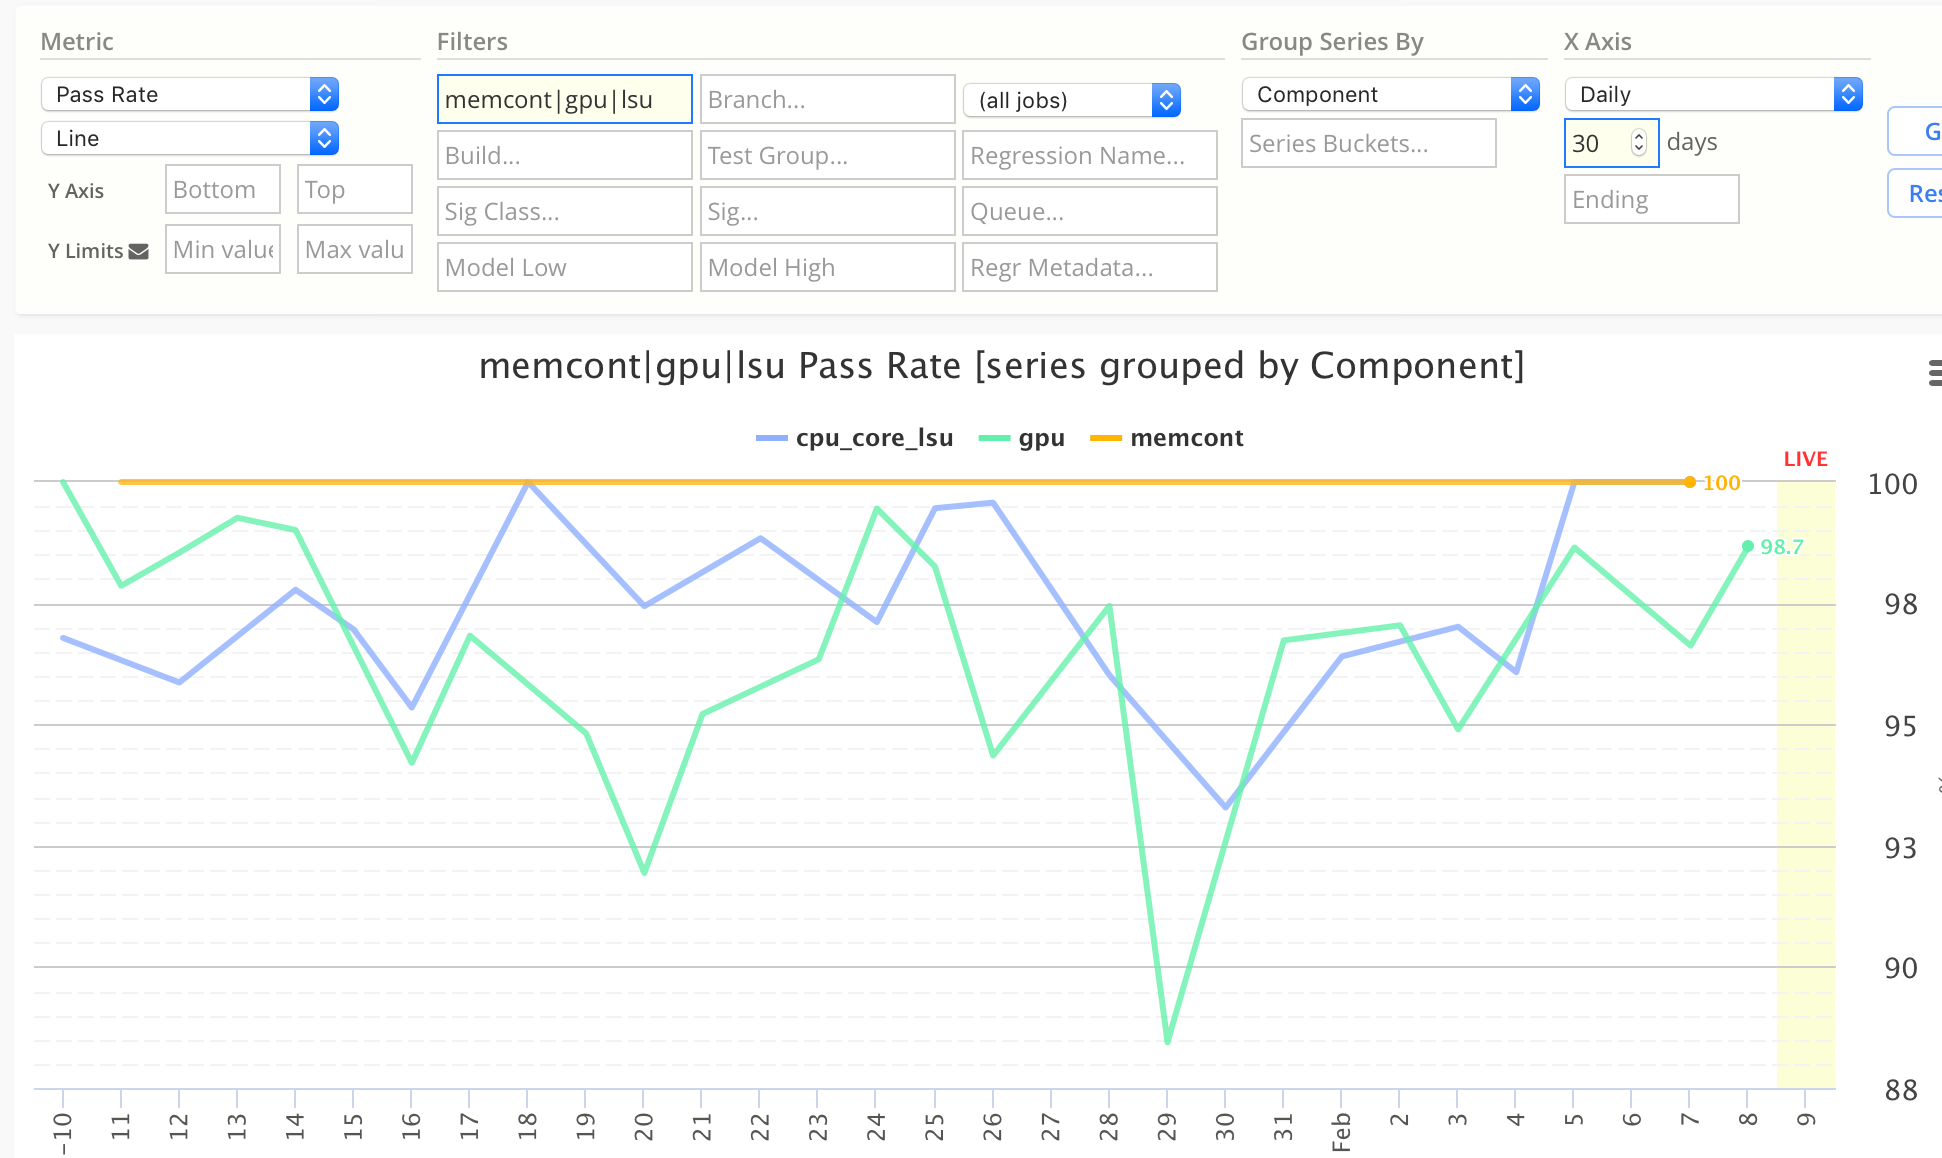
Line (connected) with multiple series
Here is a connected line chart, with multiple series.
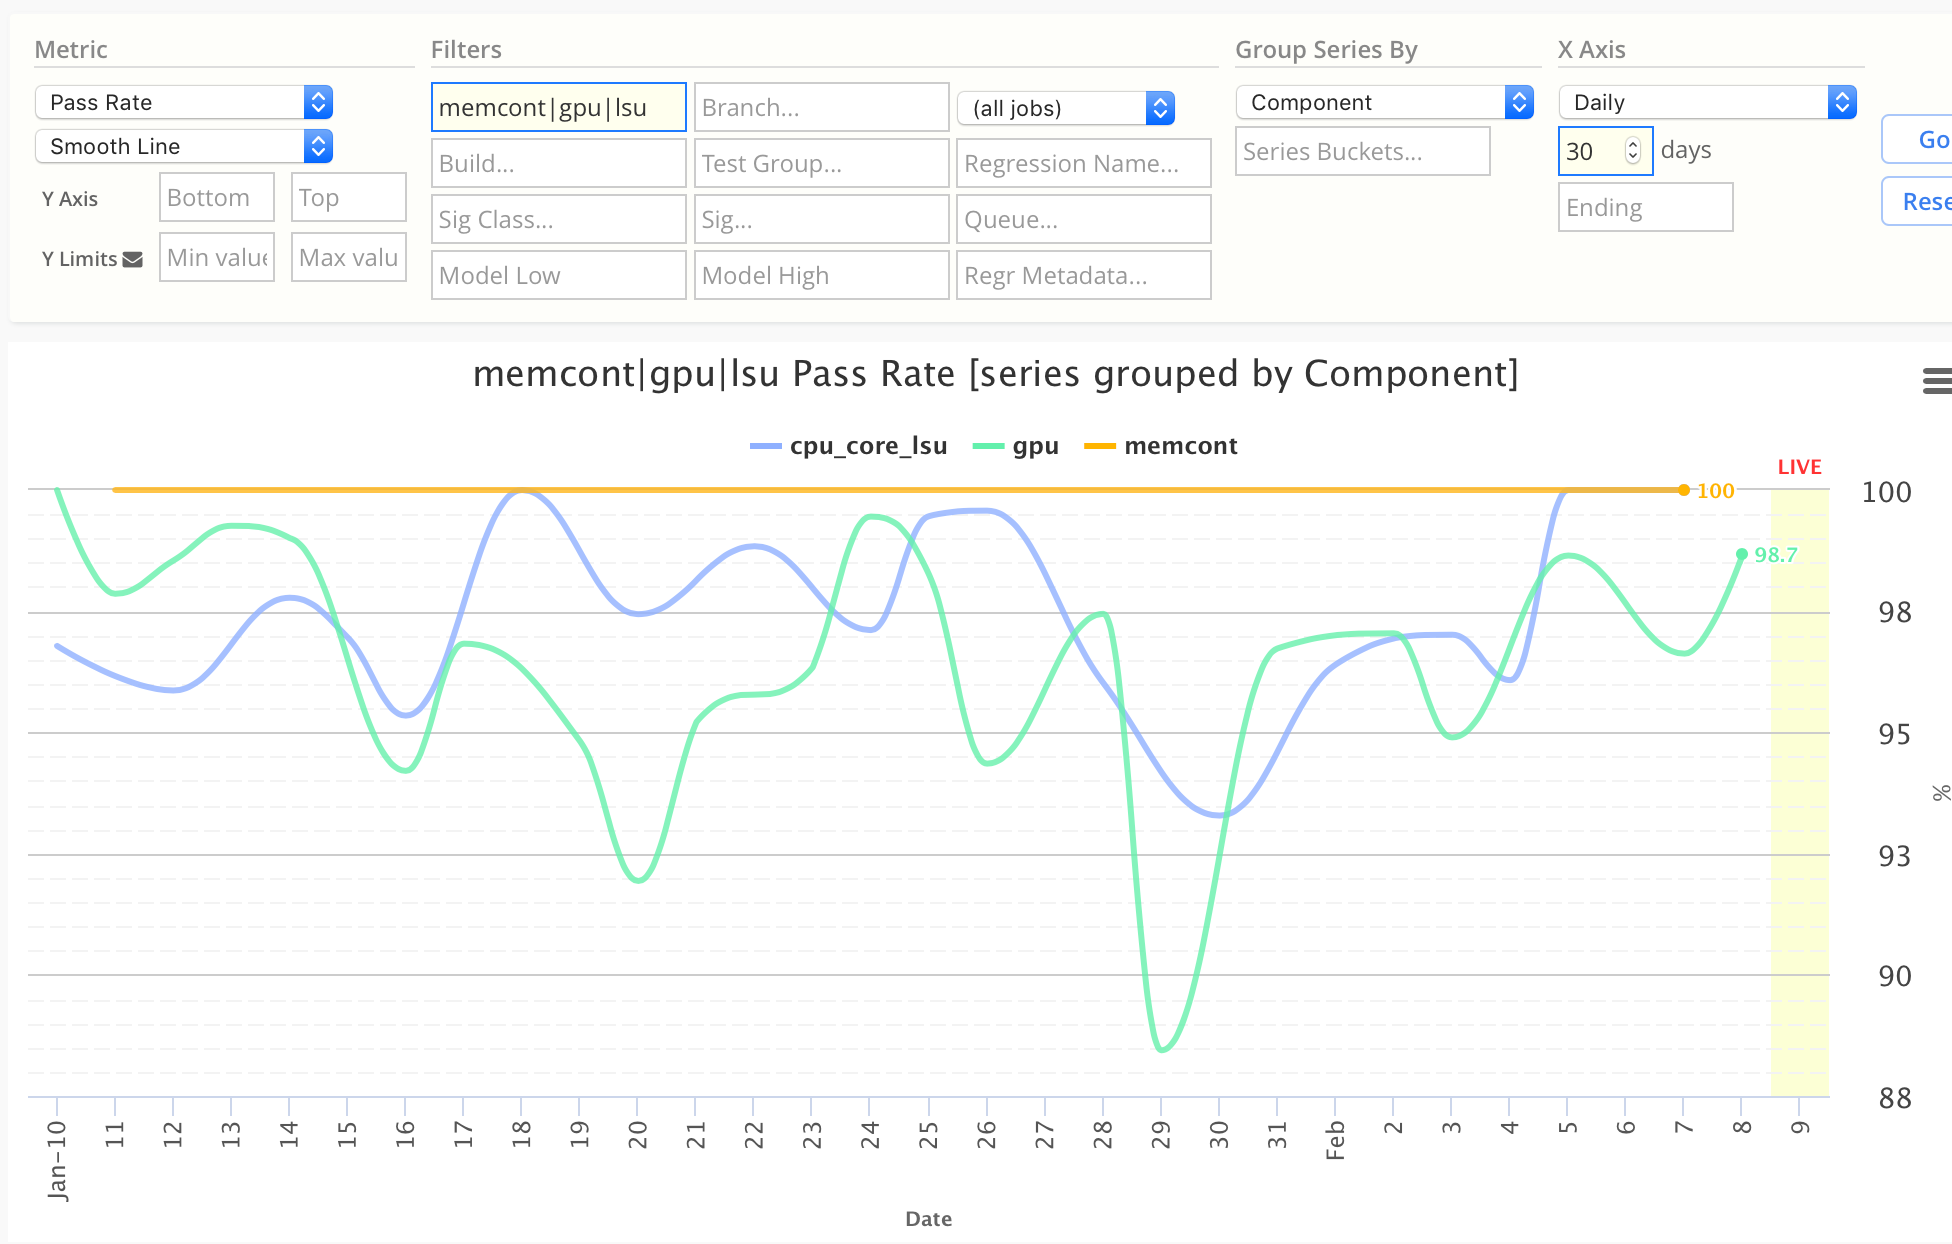
Smooth Line (aka spline chart)
Smooth line chart applies a smoothing algorithm, if data is changing rapidly.
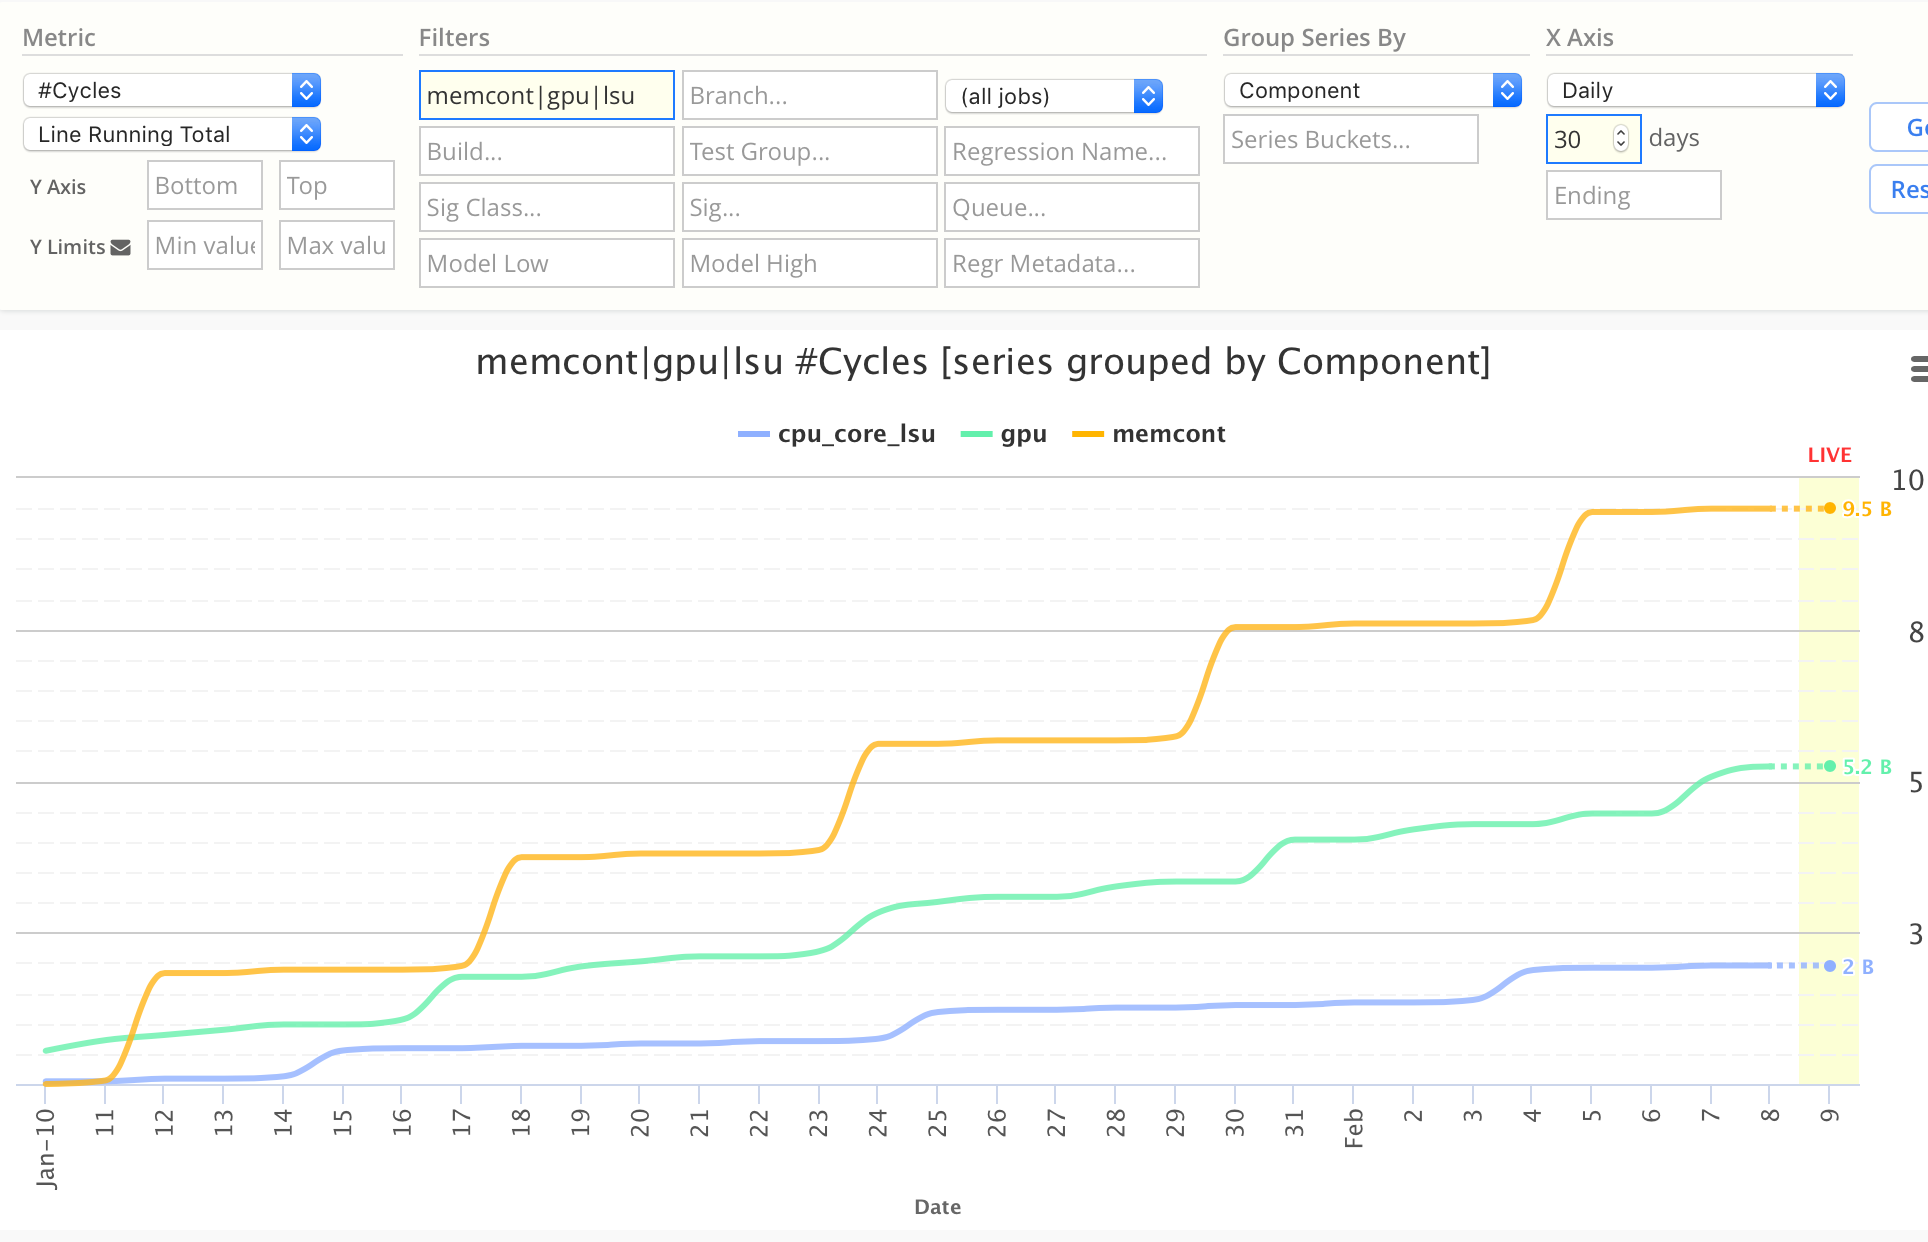
Line Running Total
Line Running Total is a cumulative chart, where each time segment value is the sum of all prior time segment values.
This is useful for generating running-total charts, like "Cumulative Cycles by Day".